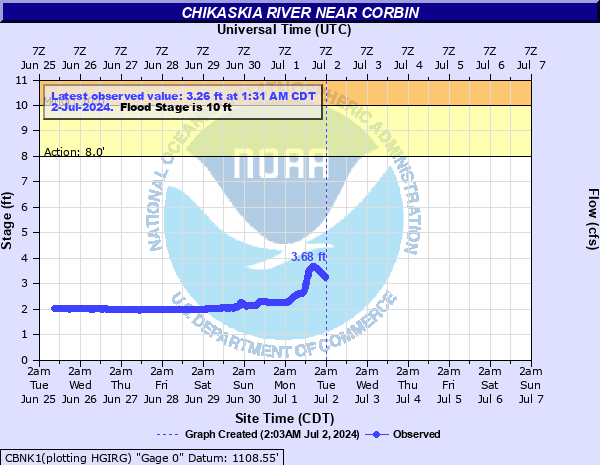
Chikaskia River near Corbin
Critical Stages
8' - Action
10' - Flood
19' - Moderate
28' - Major
Latest Observation
Updated: 11:30 AM CST 12/15/25
Status: No Flooding
Stage: 2.44 ft
Flow: 0.123 kcfs
Forecast
Forecast not available for this location.
| Time | Stage (ft) | Flow (kcfs) |
|---|---|---|
| 12:30 PM 12/15 | 2.44 | 0.123 |
| 12:15 PM 12/15 | 2.44 | 0.123 |
| 12:00 PM 12/15 | 2.44 | 0.123 |
| 11:45 AM 12/15 | 2.44 | 0.123 |
| 11:30 AM 12/15 | 2.44 | 0.123 |
| 11:15 AM 12/15 | 2.45 | 0.126 |
| 11:00 AM 12/15 | 2.45 | 0.126 |
| 10:45 AM 12/15 | 2.45 | 0.126 |
| 10:30 AM 12/15 | 2.44 | 0.123 |
| 10:15 AM 12/15 | 2.44 | 0.123 |
| 10:00 AM 12/15 | 2.45 | 0.126 |
| 9:45 AM 12/15 | 2.45 | 0.126 |
| 9:30 AM 12/15 | 2.45 | 0.126 |
| 9:15 AM 12/15 | 2.46 | 0.129 |
| 9:00 AM 12/15 | 2.46 | 0.129 |
| 8:45 AM 12/15 | 2.47 | 0.133 |
| 8:30 AM 12/15 | 2.47 | 0.133 |
| 8:15 AM 12/15 | 2.47 | 0.133 |
| 8:02 AM 12/15 | 2.48 | 0.136 |
| 8:00 AM 12/15 | 2.48 | 0.136 |
| 7:45 AM 12/15 | 2.48 | 0.136 |
| 7:30 AM 12/15 | 2.49 | 0.139 |
| 7:15 AM 12/15 | 2.49 | 0.139 |
| 7:00 AM 12/15 | 2.5 | 0.141 |
| 6:45 AM 12/15 | 2.5 | 0.141 |
| 6:30 AM 12/15 | 2.5 | 0.141 |
| 6:15 AM 12/15 | 2.5 | 0.141 |
| 6:00 AM 12/15 | 2.5 | 0.141 |
| 5:45 AM 12/15 | 2.5 | 0.141 |
| 5:30 AM 12/15 | 2.5 | 0.141 |
29.85' -
The Highway 49 River Bridge at gaging site would begin to take on water.
28' -
Major and widespread flooding is anticipated over farmland. A section of Highway 49 north of the river gage site may begin to take on water. Flood waters begin to encroach on homestead grounds northeast of the gage site.
19' -
Widespread flooding of low-lying areas and agricultural areas can be expected especially downstream.
13' -
Left bank overflows extend out to about 100 yards. A low water bridge on South Sumner Road, 3 miles downstream from gage site or 2 miles southwest of Corbin, floods.
10' -
Flooding of low-lying areas can be expected, especially along the right bank.
7' -
The left bank overflow begins with no serious flooding.
| Date | Stage (ft) |
|---|---|
| Jun 9, 1923 | 28 |
| Nov 1, 1998 | 22.9 |
| Oct 11, 1985 | 22.75 |
| Oct 10, 1985 | 22.60000038147 |
| May 17, 1951 | 22.5 |
| May 17, 1957 | 22.31 |
| Jun 17, 1975 | 22.06 |
| Apr 27, 2009 | 21.29 |
| Sep 13, 2008 | 20.07 |
| Jun 18, 2025 | 19.56 |
| May 8, 2019 | 19.5 |
| May 10, 1993 | 19.29 |
| Sep 2, 1977 | 18.25 |
| Oct 2, 1959 | 17.86000061035 |
| Oct 10, 2018 | 17.8 |
| Nov 16, 1964 | 17.70000076294 |
| May 26, 1955 | 17.54999923706 |
| Apr 1, 1983 | 17.53 |
| May 27, 2019 | 17.4 |
| May 22, 2019 | 16.94 |
Data provided by the National Weather Service.