« Back to Taylor Cemetery Rivers
Iowa River near Lone Tree (Tri-County Bridge)
Critical Stages
14' - Action
16' - Flood
18.5' - Moderate
22' - Major
Latest Observation
Updated: 4:00 PM CST 12/15/25
Status: No Flooding
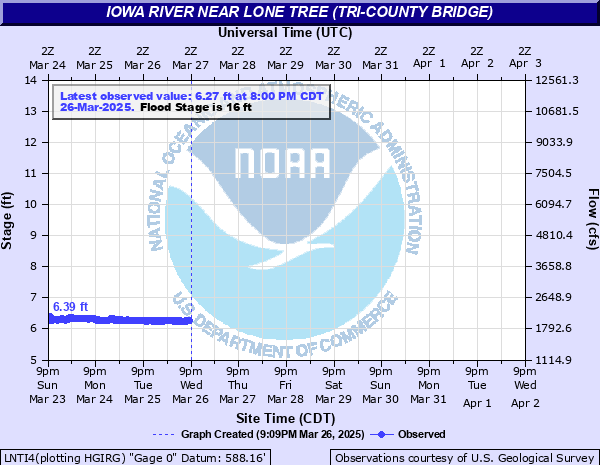
Stage: 6.39 ft
Flow: 1.89 kcfs
Forecast
Forecast not available for this location.
| Time | Stage (ft) | Flow (kcfs) |
|---|---|---|
| 5:00 PM 12/15 | 6.38 | 1.88 |
| 4:45 PM 12/15 | 6.4 | 1.9 |
| 4:30 PM 12/15 | 6.38 | 1.88 |
| 4:15 PM 12/15 | 6.38 | 1.88 |
| 4:00 PM 12/15 | 6.39 | 1.89 |
| 3:45 PM 12/15 | 6.4 | 1.9 |
| 3:30 PM 12/15 | 6.39 | 1.89 |
| 3:15 PM 12/15 | 6.39 | 1.89 |
| 3:00 PM 12/15 | 6.41 | 1.9 |
| 2:45 PM 12/15 | 6.41 | 1.9 |
| 2:30 PM 12/15 | 6.41 | 1.9 |
| 2:15 PM 12/15 | 6.4 | 1.9 |
| 2:00 PM 12/15 | 6.4 | 1.9 |
| 1:45 PM 12/15 | 6.42 | 1.91 |
| 1:30 PM 12/15 | 6.41 | 1.9 |
| 1:15 PM 12/15 | 6.4 | 1.9 |
| 1:00 PM 12/15 | 6.4 | 1.9 |
| 12:45 PM 12/15 | 6.42 | 1.91 |
| 12:30 PM 12/15 | 6.41 | 1.9 |
| 12:15 PM 12/15 | 6.42 | 1.91 |
| 12:00 PM 12/15 | 6.44 | 1.93 |
| 11:45 AM 12/15 | 6.42 | 1.91 |
| 11:30 AM 12/15 | 6.4 | 1.9 |
| 11:15 AM 12/15 | 6.39 | 1.89 |
| 11:00 AM 12/15 | 6.4 | 1.9 |
| 10:45 AM 12/15 | 6.46 | 1.95 |
| 10:30 AM 12/15 | 6.41 | 1.9 |
| 10:15 AM 12/15 | 6.45 | 1.94 |
| 10:00 AM 12/15 | 6.43 | 1.92 |
| 9:45 AM 12/15 | 6.47 | 1.96 |
22' -
Major Flood Stage. Hills access is flooded.
20' -
Water reaches the bottom of the County Road W66 bridge deck.
19' -
Tri-County Bridge is closed as there is no access from the east side due to the roadway being flooded. Homes on Lola Lane, Y Avenue and near the Tri-County Bridge are affected as access is cut off due to flooded roads.
18.5' -
Moderate Flood Stage: River Junction Access is flooded. Low lying rural roads are under water.
18' -
Sand Road closes south of 520th Street to the Highway 22 intersection.
16' -
Flood Stage. Flood waters affect parts of Lola Lane and Y Avenue. River Junction Access Park is closed.
15' -
Water nears low lying roads and reaches agricultural levees.
14' -
Water reaches the tops of the river banks.
| Date | Stage (ft) |
|---|---|
| Jun 15, 2008 | 23.1 |
| Jul 7, 1993 | 22.94 |
| Jul 3, 2014 | 22.13 |
| Apr 19, 2013 | 21.99 |
| Oct 9, 2018 | 20.39 |
| Sep 22, 1965 | 20.27 |
| May 25, 1944 | 19.94 |
| Mar 15, 2019 | 19.09 |
| May 19, 1974 | 18.97 |
| May 11, 1996 | 18.44 |
| Feb 21, 1971 | 18.38 |
| Jun 20, 1990 | 18.08 |
| Apr 1, 1960 | 17.9 |
| Mar 10, 2009 | 17.8 |
| Mar 21, 1962 | 17.68 |
| Aug 5, 2010 | 17.68 |
| Feb 21, 1997 | 17.32 |
| Jan 19, 1973 | 17.08 |
| Feb 18, 2011 | 17.05 |
| Mar 20, 1979 | 17.01 |
Data provided by the National Weather Service.