Navasota River near Normangee
Critical Stages
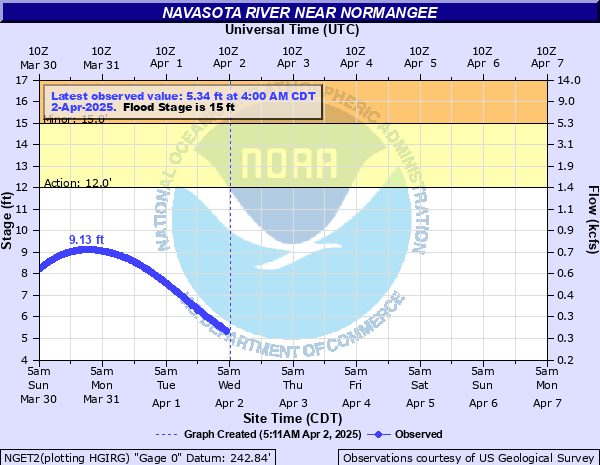
12' - Action
15' - Flood
18' - Moderate
20' - Major
Latest Observation
Updated: 9:00 PM CST 12/14/25
Status: No Flooding
Stage: 1.95 ft
Flow: 0.05 kcfs
Forecast
Forecast not available for this location.
| Time | Stage (ft) | Flow (kcfs) |
|---|---|---|
| 9:00 PM 12/14 | 1.95 | 0.05 |
| 8:45 PM 12/14 | 1.95 | 0.05 |
| 8:30 PM 12/14 | 1.94 | 0.0496 |
| 8:15 PM 12/14 | 1.94 | 0.0496 |
| 8:00 PM 12/14 | 1.94 | 0.0496 |
| 7:45 PM 12/14 | 1.94 | 0.0496 |
| 7:30 PM 12/14 | 1.93 | 0.0492 |
| 7:15 PM 12/14 | 1.93 | 0.0492 |
| 7:00 PM 12/14 | 1.92 | 0.0488 |
| 6:45 PM 12/14 | 1.92 | 0.0488 |
| 6:30 PM 12/14 | 1.92 | 0.0488 |
| 6:15 PM 12/14 | 1.91 | 0.0484 |
| 6:00 PM 12/14 | 1.91 | 0.0484 |
| 5:45 PM 12/14 | 1.91 | 0.0484 |
| 5:30 PM 12/14 | 1.91 | 0.0484 |
| 5:15 PM 12/14 | 1.9 | 0.048 |
| 5:00 PM 12/14 | 1.9 | 0.048 |
| 4:45 PM 12/14 | 1.91 | 0.0484 |
| 4:30 PM 12/14 | 1.9 | 0.048 |
| 4:15 PM 12/14 | 1.9 | 0.048 |
| 4:00 PM 12/14 | 1.89 | 0.0476 |
| 3:45 PM 12/14 | 1.9 | 0.048 |
| 3:30 PM 12/14 | 1.9 | 0.048 |
| 3:15 PM 12/14 | 1.89 | 0.0476 |
| 3:00 PM 12/14 | 1.88 | 0.0472 |
| 2:45 PM 12/14 | 1.88 | 0.0472 |
| 2:30 PM 12/14 | 1.87 | 0.0468 |
| 2:15 PM 12/14 | 1.87 | 0.0468 |
| 2:00 PM 12/14 | 1.87 | 0.0468 |
| 1:45 PM 12/14 | 1.87 | 0.0468 |
20' -
Major lowland flooding begins with massive inundation of the floodplain as the river is close to 2 miles wide and OSR become inundated one half mile on the right bank and 1.5 miles on the left bank.
18' -
Moderate lowland flooding begins as three channels merge into one below State Highway 21. There is widespread inundation of the floodplain in the vicinity of the gage with the river more than 1.5 miles wide. Long Trussel Road in northeast Brazos County below State Highway 21 becomes inundated.
17' -
Minor lowland flooding continues with widespread inundation of the floodplain in the vicinity of the gage with the river more than 1 mile wide. Long Trussel Road in northeast Brazos County below State Highway 21 is threatened.
15' -
Minor lowland flooding begins as water escapes the main channel and inundates the floodplain.
| Date | Stage (ft) |
|---|---|
| May 4, 2024 | 25.61 |
| May 1, 2009 | 22.72 |
| Mar 11, 2016 | 22.39 |
| Jan 31, 1999 | 20.53 |
| May 15, 2024 | 20.33 |
| Apr 14, 2017 | 20.15 |
| May 28, 2015 | 19.77 |
| Jun 3, 2021 | 19.57 |
| Mar 23, 2012 | 19.57 |
| Nov 2, 2013 | 19.54 |
| Jun 2, 2024 | 19.52 |
| Dec 19, 2001 | 19.3 |
| Jan 5, 2019 | 19.22 |
| May 5, 2007 | 19.13 |
| Jan 9, 1998 | 19 |
| Jul 17, 2007 | 18.92 |
| Feb 23, 2003 | 18.67 |
| Jan 16, 2007 | 18.5 |
| Oct 21, 1998 | 18.17 |
| Apr 27, 2019 | 18.16 |
Data provided by the National Weather Service.