« Back to The Woodlands Rivers
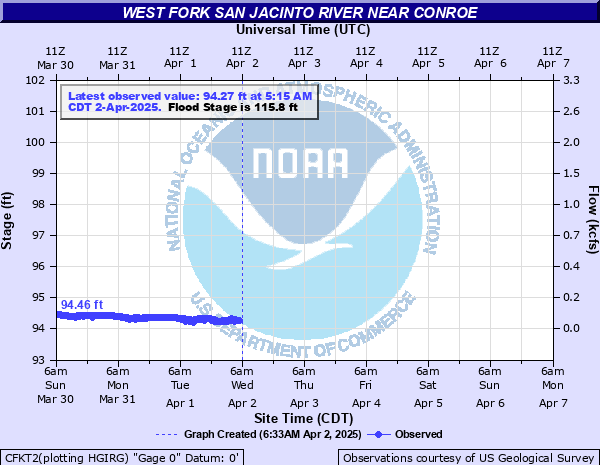
West Fork San Jacinto River near Conroe
Critical Stages
114.8' - Action
115.8' - Flood
116.8' - Moderate
117.8' - Major
Latest Observation
Updated: 10:15 PM CST 12/14/25
Status: No Flooding
Stage: 94.03 ft
Flow: 0.0495 kcfs
Forecast
Forecast not available for this location.
| Time | Stage (ft) | Flow (kcfs) |
|---|---|---|
| 10:15 PM 12/14 | 94.03 | 0.0495 |
| 10:00 PM 12/14 | 94.02 | 0.0487 |
| 9:45 PM 12/14 | 94.02 | 0.0487 |
| 9:30 PM 12/14 | 94.02 | 0.0487 |
| 9:15 PM 12/14 | 94.02 | 0.0487 |
| 9:00 PM 12/14 | 94.02 | 0.0487 |
| 8:45 PM 12/14 | 94.02 | 0.0487 |
| 8:30 PM 12/14 | 94.02 | 0.0487 |
| 8:15 PM 12/14 | 94.01 | 0.0478 |
| 8:00 PM 12/14 | 94.01 | 0.0478 |
| 7:45 PM 12/14 | 94.01 | 0.0478 |
| 7:30 PM 12/14 | 94.01 | 0.0478 |
| 7:15 PM 12/14 | 94.01 | 0.0478 |
| 7:00 PM 12/14 | 94 | 0.047 |
| 6:45 PM 12/14 | 94 | 0.047 |
| 6:30 PM 12/14 | 94 | 0.047 |
| 6:15 PM 12/14 | 94 | 0.047 |
| 6:00 PM 12/14 | 94 | 0.047 |
| 5:45 PM 12/14 | 94 | 0.047 |
| 5:30 PM 12/14 | 94 | 0.047 |
| 5:15 PM 12/14 | 93.97 | 0.0444 |
| 5:00 PM 12/14 | 93.99 | 0.0461 |
| 4:45 PM 12/14 | 93.96 | 0.0436 |
| 4:30 PM 12/14 | 93.98 | 0.0453 |
| 4:15 PM 12/14 | 93.94 | 0.042 |
| 4:00 PM 12/14 | 93.94 | 0.042 |
| 3:45 PM 12/14 | 93.91 | 0.0397 |
| 3:30 PM 12/14 | 93.92 | 0.0405 |
| 3:15 PM 12/14 | 93.96 | 0.0436 |
| 3:00 PM 12/14 | 93.91 | 0.0397 |
126.93' -
Flood of Record set on 8/29/2017 during Harvey
126.09' -
Previous flood of record on October 18, 1994.
117.8' -
Major lowland flooding begins.
116.8' -
Moderate lowland flooding begins.
115.8' -
Minor lowland flooding begins.
| Date | Stage (ft) |
|---|---|
| Aug 29, 2017 | 126.93 |
| Oct 18, 1994 | 126.1 |
| Jun 3, 1950 | 123.22 |
| Aug 30, 1945 | 123.15 |
| May 1, 1922 | 123 |
| Apr 22, 1926 | 123 |
| May 3, 2024 | 121.82 |
| Jun 27, 1960 | 121.78 |
| Nov 6, 1946 | 121.75 |
| Nov 14, 1998 | 121.61 |
| Mar 14, 1946 | 121.47 |
| May 28, 2016 | 121.14 |
| May 30, 1929 | 120.5 |
| Apr 19, 1959 | 120.36 |
| Apr 10, 1942 | 120.26 |
| Jun 12, 1940 | 119.91 |
| Feb 1, 1944 | 119.9 |
| May 1, 1957 | 119.75 |
| May 16, 1953 | 119.75 |
| Feb 7, 1955 | 119.7 |
Data provided by the National Weather Service.