« Back to The Woodlands Rivers
Buffalo Bayou at Piney Point Village
Critical Stages
49' - Action
52' - Flood
57' - Moderate
60' - Major
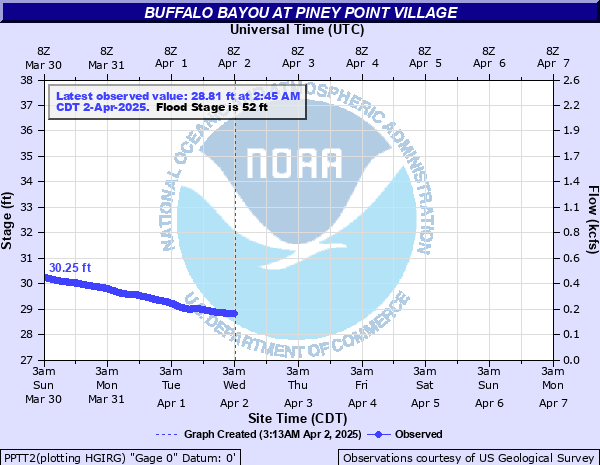
Latest Observation
Updated: 11:00 PM CST 12/14/25
Status: No Flooding
Stage: 28.33 ft
Flow: 0.152 kcfs
Forecast
Forecast not available for this location.
| Time | Stage (ft) | Flow (kcfs) |
|---|---|---|
| 11:00 PM 12/14 | 28.33 | 0.152 |
| 10:45 PM 12/14 | 28.33 | 0.152 |
| 10:30 PM 12/14 | 28.33 | 0.152 |
| 10:15 PM 12/14 | 28.33 | 0.152 |
| 10:00 PM 12/14 | 28.33 | 0.152 |
| 9:45 PM 12/14 | 28.33 | 0.152 |
| 9:30 PM 12/14 | 28.32 | 0.151 |
| 9:15 PM 12/14 | 28.32 | 0.151 |
| 9:00 PM 12/14 | 28.32 | 0.151 |
| 8:45 PM 12/14 | 28.32 | 0.151 |
| 8:30 PM 12/14 | 28.31 | 0.149 |
| 8:15 PM 12/14 | 28.31 | 0.149 |
| 8:00 PM 12/14 | 28.31 | 0.149 |
| 7:45 PM 12/14 | 28.31 | 0.149 |
| 7:30 PM 12/14 | 28.32 | 0.151 |
| 7:15 PM 12/14 | 28.31 | 0.149 |
| 7:00 PM 12/14 | 28.31 | 0.149 |
| 6:45 PM 12/14 | 28.31 | 0.149 |
| 6:30 PM 12/14 | 28.32 | 0.151 |
| 6:15 PM 12/14 | 28.32 | 0.151 |
| 6:00 PM 12/14 | 28.31 | 0.149 |
| 5:45 PM 12/14 | 28.32 | 0.151 |
| 5:30 PM 12/14 | 28.32 | 0.151 |
| 5:15 PM 12/14 | 28.31 | 0.149 |
| 5:00 PM 12/14 | 28.32 | 0.151 |
| 4:45 PM 12/14 | 28.32 | 0.151 |
| 4:30 PM 12/14 | 28.32 | 0.151 |
| 4:15 PM 12/14 | 28.31 | 0.149 |
| 4:00 PM 12/14 | 28.31 | 0.149 |
| 3:45 PM 12/14 | 28.31 | 0.149 |
60' -
At levels above 60.0 feet, major lowland flooding begins as homes above the gage begin to flood and several streets near the gage are inundated.
59.3' -
At levels above 59.3 feet, the bridge at Briar Forest SW is inundated.
57' -
At levels above 57.0 feet, moderate lowland flooding begins as portions of Briar Forest Drive begin to flood.
53.5' -
At levels above 54.5 feet, garages on Arrowhead begin to flood.
52' -
At levels above 52.0 feet, minor lowland flooding begins as pool decks, tennis courts, and lower garage area are inundated.
| Date | Stage (ft) |
|---|---|
| Aug 31, 2017 | 62.84 |
| Mar 4, 1992 | 61.23 |
| Sep 11, 1998 | 59.82 |
| May 26, 2015 | 58.28 |
| Apr 18, 2016 | 57.75 |
| May 18, 1989 | 57.31 |
| Apr 28, 2009 | 57.25 |
| Aug 31, 1981 | 57.2 |
| Nov 18, 2003 | 57.02 |
| Sep 19, 1983 | 55.6 |
| Sep 19, 1979 | 55.15 |
| Jun 13, 1973 | 54.98 |
| Sep 13, 2008 | 54.7 |
| May 22, 1997 | 54.69 |
| Oct 16, 2006 | 54.49 |
| Mar 28, 2001 | 54.44 |
| Oct 18, 1994 | 54.11 |
| Oct 29, 2002 | 54.03 |
| Jun 9, 2001 | 53.61 |
| Mar 21, 1972 | 53.47 |
Data provided by the National Weather Service.