Ocmulgee River at Abbeville
Critical Stages
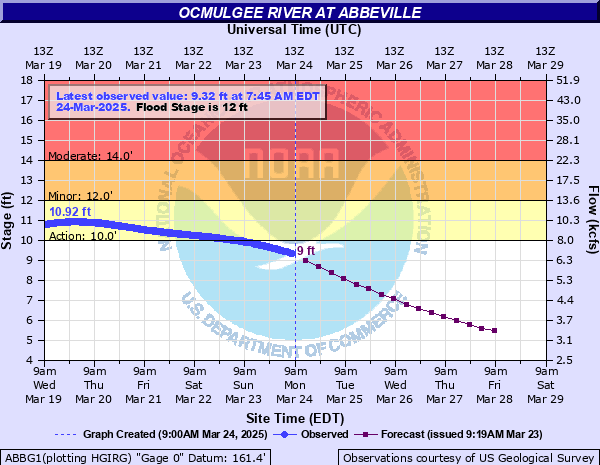
10' - Action
12' - Flood
14' - Moderate
18' - Major
Latest Observation
Updated: 5:45 AM EST 12/15/25
Status: No Flooding
Stage: 2.39 ft
Flow: 1.84 kcfs
Forecast
Forecast not available for this location.
| Time | Stage (ft) | Flow (kcfs) |
|---|---|---|
| 6:45 AM 12/15 | 2.38 | 1.83 |
| 6:30 AM 12/15 | 2.39 | 1.84 |
| 6:15 AM 12/15 | 2.39 | 1.84 |
| 6:00 AM 12/15 | 2.39 | 1.84 |
| 5:45 AM 12/15 | 2.39 | 1.84 |
| 5:30 AM 12/15 | 2.4 | 1.84 |
| 5:15 AM 12/15 | 2.4 | 1.84 |
| 5:00 AM 12/15 | 2.4 | 1.84 |
| 4:45 AM 12/15 | 2.4 | 1.84 |
| 4:30 AM 12/15 | 2.41 | 1.85 |
| 4:15 AM 12/15 | 2.41 | 1.85 |
| 4:00 AM 12/15 | 2.41 | 1.85 |
| 3:45 AM 12/15 | 2.41 | 1.85 |
| 3:30 AM 12/15 | 2.42 | 1.85 |
| 3:15 AM 12/15 | 2.42 | 1.85 |
| 3:00 AM 12/15 | 2.42 | 1.85 |
| 2:45 AM 12/15 | 2.43 | 1.86 |
| 2:30 AM 12/15 | 2.43 | 1.86 |
| 2:15 AM 12/15 | 2.43 | 1.86 |
| 2:00 AM 12/15 | 2.43 | 1.86 |
| 1:45 AM 12/15 | 2.44 | 1.86 |
| 1:30 AM 12/15 | 2.43 | 1.86 |
| 1:15 AM 12/15 | 2.44 | 1.86 |
| 1:00 AM 12/15 | 2.45 | 1.87 |
| 12:45 AM 12/15 | 2.45 | 1.87 |
| 12:30 AM 12/15 | 2.46 | 1.87 |
| 12:15 AM 12/15 | 2.46 | 1.87 |
| 12:00 AM 12/15 | 2.46 | 1.87 |
| 11:45 PM 12/14 | 2.46 | 1.87 |
| 11:30 PM 12/14 | 2.47 | 1.88 |
23' -
Widespread inundation flooding occurs. Many homes will be flooded out along the river in Abbeville. The record crest was 23.1 feet on July 11...1994.
20' -
Major flooding continues. When the river rises to 20 feet...several farm houses become isolated.
18' -
Major flooding begins. Homes begin to flood on the west side of the river in Abbeville just downstream from the boat ramp and park. Residents will need to be evacuated by boat if not already out.
16' -
Flooding of farm lands...timberlands...and access roads will occur.
14' -
Moderate flooding begins. Roads to homes along the west side of the river in Abbeville become inaccessible.
13' -
Minor flooding of lowlands adjacent to the river continue to expand into the flood plain. Flooding of the nearby park and parking lot at the Abbeville boat ramp also expands.
12' -
Flood Stage is reached. Minor flooding of lowlands adjacent to the river begins. The water level reaches the top of the Abbeville boat ramp and also begins to flood the nearby park.
10' -
Bankfull conditions begin upstream and downstream from the gage at Highway 286. Water begins to spill out into low lying areas of the flood plain.
| Date | Stage (ft) |
|---|---|
| Jul 11, 1994 | 23.1 |
| Jan 23, 1925 | 20.3 |
| Apr 13, 1936 | 19.7 |
| Dec 4, 1948 | 19.6 |
| Mar 10, 1929 | 19.6 |
| Dec 25, 1997 | 19.2 |
| Mar 21, 1913 | 19 |
| Mar 14, 1998 | 18.7 |
| Dec 31, 2015 | 18.11 |
| Mar 22, 1912 | 18.1 |
| Mar 28, 1942 | 17.8 |
| Mar 28, 1944 | 17.7 |
| Mar 4, 1961 | 17.7 |
| Apr 14, 1964 | 17.6 |
| May 2, 1902 | 17.5 |
| Feb 25, 2020 | 17.14 |
| Apr 4, 2009 | 16.9 |
| Feb 10, 1998 | 16.6 |
| Mar 29, 2005 | 16.6 |
| Dec 3, 1992 | 16.5 |
Data provided by the National Weather Service.