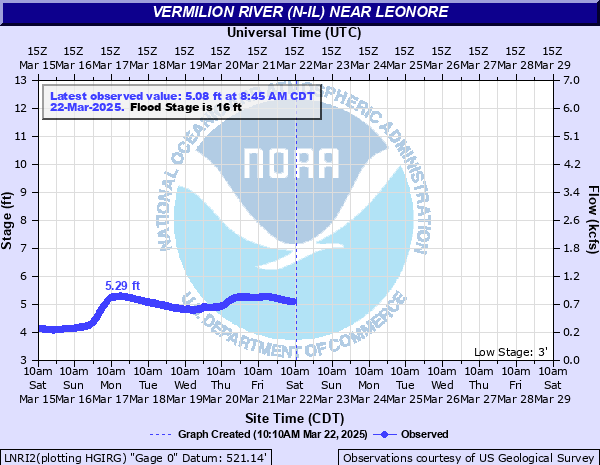
Vermilion River (N-IL) near Leonore
Critical Stages
15.5' - Action
16' - Flood
21' - Moderate
26' - Major
Latest Observation
Updated: 2:45 PM CST 12/15/25
Status: No Flooding
Stage: 3.29 ft
Flow: 0.0495 kcfs
Forecast
Forecast not available for this location.
| Time | Stage (ft) | Flow (kcfs) |
|---|---|---|
| 2:45 PM 12/15 | 3.29 | 0.0495 |
| 2:30 PM 12/15 | 3.28 | 0.0481 |
| 2:15 PM 12/15 | 3.27 | 0.0467 |
| 2:00 PM 12/15 | 3.27 | 0.0467 |
| 1:45 PM 12/15 | 3.27 | 0.0467 |
| 1:30 PM 12/15 | 3.27 | 0.0467 |
| 1:15 PM 12/15 | 3.26 | 0.0454 |
| 1:00 PM 12/15 | 3.26 | 0.0454 |
| 12:45 PM 12/15 | 3.26 | 0.0454 |
| 12:30 PM 12/15 | 3.26 | 0.0454 |
| 12:15 PM 12/15 | 3.26 | 0.0454 |
| 12:00 PM 12/15 | 3.26 | 0.0454 |
| 11:45 AM 12/15 | 3.26 | 0.0454 |
| 11:30 AM 12/15 | 3.26 | 0.0454 |
| 11:15 AM 12/15 | 3.26 | 0.0454 |
| 11:00 AM 12/15 | 3.26 | 0.0454 |
| 10:45 AM 12/15 | 3.26 | 0.0454 |
| 10:30 AM 12/15 | 3.26 | 0.0454 |
| 10:15 AM 12/15 | 3.26 | 0.0454 |
| 10:00 AM 12/15 | 3.27 | 0.0467 |
| 9:45 AM 12/15 | 3.27 | 0.0467 |
| 9:30 AM 12/15 | 3.27 | 0.0467 |
| 9:15 AM 12/15 | 3.27 | 0.0467 |
| 9:00 AM 12/15 | 3.27 | 0.0467 |
| 8:45 AM 12/15 | 3.27 | 0.0467 |
| 8:30 AM 12/15 | 3.27 | 0.0467 |
| 8:15 AM 12/15 | 3.27 | 0.0467 |
| 8:00 AM 12/15 | 3.27 | 0.0467 |
| 7:45 AM 12/15 | 3.28 | 0.0481 |
| 7:30 AM 12/15 | 3.27 | 0.0467 |
38' -
1251st Road is threatened near Leonore.
30' -
Water may reach the top of the levee west of the river in Streator. Water may reach the top of the levee at the water treatment plant in Streator. Oakley Avenue may be threatened north of Streator.
29' -
Main Street may be threatened in Streator.
25' -
18th Road may be threatened north of Streator.
24' -
Without flood protection, multiple roadways and structures may be threatened west of the river near Armory Court in Streator.
21' -
Widespread inundation of agricultural land may occur near Streator and Leonore.
16' -
Water overtops banks at multiple locations along the river near Streator and Leonore.
14' -
Water overtops low-lying banks in Streator.
| Date | Stage (ft) |
|---|---|
| Apr 18, 2013 | 30.25 |
| Dec 4, 1982 | 27.13 |
| Jan 9, 2008 | 25.22 |
| Dec 29, 2015 | 25.1 |
| May 2, 2019 | 24.5 |
| Sep 15, 2008 | 24.3 |
| May 16, 2009 | 23.47 |
| Mar 5, 1979 | 23.46 |
| Nov 28, 1990 | 23.17 |
| Feb 14, 1984 | 23.05 |
| May 13, 2002 | 22.9 |
| Jan 14, 2005 | 22.79 |
| Mar 24, 2007 | 22.75 |
| Feb 21, 1997 | 22.5 |
| Jun 2, 1980 | 22.25 |
| Oct 5, 1986 | 22.23 |
| Mar 12, 1990 | 21.67 |
| Nov 19, 1985 | 21.63 |
| Jun 6, 2001 | 21.17 |
| May 29, 1996 | 21.02 |
Data provided by the National Weather Service.