Rio Puerco near Bernardo
Critical Stages
18' - Action
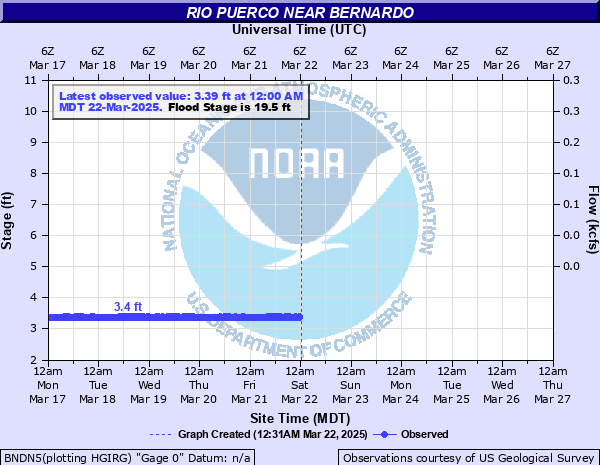
19.5' - Flood
23' - Moderate
27' - Major
Latest Observation
Updated: 10:00 PM MST 12/14/25
Status: No Flooding
Stage: 4.1 ft
Flow: -999 kcfs
Forecast
Forecast not available for this location.
| Time | Stage (ft) | Flow (kcfs) |
|---|---|---|
| 11:00 PM 12/14 | 4.12 | -999 |
| 10:45 PM 12/14 | 4.12 | -999 |
| 10:30 PM 12/14 | 4.12 | -999 |
| 10:15 PM 12/14 | 4.12 | -999 |
| 10:00 PM 12/14 | 4.1 | -999 |
| 9:45 PM 12/14 | 4.11 | -999 |
| 9:30 PM 12/14 | 4.1 | -999 |
| 9:15 PM 12/14 | 4.11 | -999 |
| 9:00 PM 12/14 | 4.12 | -999 |
| 8:45 PM 12/14 | 4.12 | -999 |
| 8:30 PM 12/14 | 4.11 | -999 |
| 8:15 PM 12/14 | 4.12 | -999 |
| 8:00 PM 12/14 | 4.13 | -999 |
| 7:45 PM 12/14 | 4.13 | -999 |
| 7:30 PM 12/14 | 4.12 | -999 |
| 7:15 PM 12/14 | 4.12 | -999 |
| 7:00 PM 12/14 | 4.12 | -999 |
| 6:45 PM 12/14 | 4.12 | -999 |
| 6:30 PM 12/14 | 4.13 | -999 |
| 6:15 PM 12/14 | 4.13 | -999 |
| 6:00 PM 12/14 | 4.13 | -999 |
| 5:45 PM 12/14 | 4.13 | -999 |
| 5:30 PM 12/14 | 4.12 | -999 |
| 5:15 PM 12/14 | 4.13 | -999 |
| 5:00 PM 12/14 | 4.13 | -999 |
| 4:45 PM 12/14 | 4.13 | -999 |
| 4:30 PM 12/14 | 4.13 | -999 |
| 4:15 PM 12/14 | 4.13 | -999 |
| 4:00 PM 12/14 | 4.13 | -999 |
| 3:45 PM 12/14 | 4.13 | -999 |
23' -
Streets in the village of San Francisco between interstate 25 and the Rio Grande just south of Bernardo are being flooded. Water levels in the Lower Rio Puerco have not been this high since July of 1944. The nearby railroad bridge may also be flooded. Further rises will impact Interstate 25 traffic.
19.5' -
At the initial flood stage of 19.5 feet, the water level in the Lower Rio Puerco will begin to threaten several homes and structures in the village of San Francisco between Interstate 25 and the Rio Grande. Further rises in water levels would begin to flood the village of San Francisco. The last time the water level reached 19.5 feet in the Rio Puerco near Bernardo was August 10 2006.
| Date | Stage (ft) |
|---|---|
| Sep 23, 1941 | 27.9 |
| Sep 16, 2013 | 21.22 |
| Jul 27, 2018 | 20.27 |
| Sep 16, 2013 | 19.79 |
| Aug 10, 2006 | 19.52 |
| Aug 12, 1955 | 16.9 |
| Aug 13, 1967 | 16.6 |
| Sep 27, 1954 | 15.75 |
| Aug 18, 1994 | 15.71 |
| Sep 14, 2003 | 15.56 |
| Aug 18, 1956 | 15 |
| Sep 14, 1972 | 14.5 |
| Oct 24, 1969 | 13.3 |
| Apr 7, 2004 | 12.02 |
| Aug 6, 1999 | 11.18 |
| Sep 25, 1997 | 10.44 |
| Jun 28, 1996 | 10.25 |
Data provided by the National Weather Service.