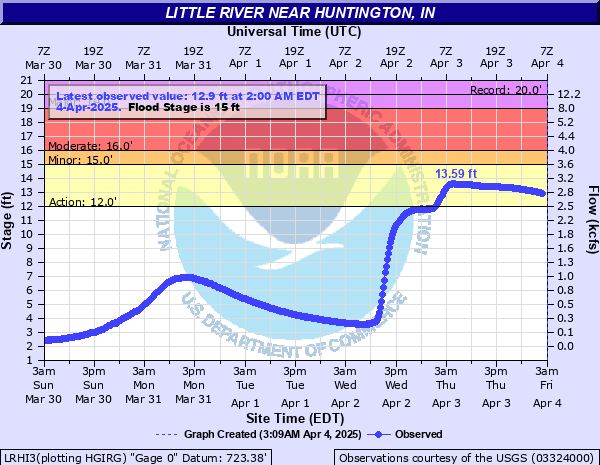
Little River near Huntington
Critical Stages
12' - Action
15' - Flood
16' - Moderate
19' - Major
Latest Observation
Updated: 10:00 PM EST 12/14/25
Status: No Flooding
Stage: 1.9 ft
Flow: 0.0381 kcfs
Forecast
Forecast not available for this location.
| Time | Stage (ft) | Flow (kcfs) |
|---|---|---|
| 10:00 PM 12/14 | 1.9 | 0.0381 |
| 9:45 PM 12/14 | 1.92 | 0.0395 |
| 9:30 PM 12/14 | 1.93 | 0.0403 |
| 9:15 PM 12/14 | 1.95 | 0.0417 |
| 9:00 PM 12/14 | 1.96 | 0.0423 |
| 8:45 PM 12/14 | 1.97 | 0.043 |
| 8:30 PM 12/14 | 1.96 | 0.0423 |
| 8:15 PM 12/14 | 1.56 | 0.0179 |
| 8:00 PM 12/14 | 1.89 | 0.0374 |
| 7:45 PM 12/14 | 1.95 | 0.0417 |
| 7:30 PM 12/14 | 1.98 | 0.0437 |
| 7:15 PM 12/14 | 1.99 | 0.0444 |
| 7:00 PM 12/14 | 2 | 0.0451 |
| 6:45 PM 12/14 | 2.01 | 0.0458 |
| 6:30 PM 12/14 | 1.97 | 0.043 |
| 6:15 PM 12/14 | 1.89 | 0.0374 |
| 6:00 PM 12/14 | 1.97 | 0.043 |
| 5:45 PM 12/14 | 2 | 0.0451 |
| 5:30 PM 12/14 | 2.02 | 0.0465 |
| 5:15 PM 12/14 | 2.02 | 0.0465 |
| 5:00 PM 12/14 | 2.03 | 0.0473 |
| 4:45 PM 12/14 | 2.03 | 0.0473 |
| 4:30 PM 12/14 | 2.03 | 0.0473 |
| 4:15 PM 12/14 | 2.01 | 0.0458 |
| 4:00 PM 12/14 | 1.96 | 0.0423 |
| 3:45 PM 12/14 | 1.97 | 0.043 |
| 3:30 PM 12/14 | 1.99 | 0.0444 |
| 3:15 PM 12/14 | 1.98 | 0.0437 |
| 3:00 PM 12/14 | 1.97 | 0.043 |
| 2:45 PM 12/14 | 1.96 | 0.0423 |
21' -
At this level, flooding exceeds the record flood. Massive inundation and damage and the closure of primary roads and bridges can be expected. Many evacuations can also be expected.
20' -
Flooding approaches the height of the record flood. There is extensive inundation and damage with many primary roads and bridges closed. Many evacuations can be expected at this level.
19' -
At this level, many roads and bridges will be closed and there will be extensive inundation and damage with many evacuations.
18' -
Extensive flooding is in progress.
16' -
Moderate flooding is in progress. Secondary roads are blocked by flood waters. People in these areas should move property to higher ground and those nearest the river may have to evacuate their homes.
15' -
Secondary roads are blocked by flood waters and moderate agricultural flooding is in progress.
14' -
Minor agricultural flooding is in progress with minimal damage expected.
| Date | Stage (ft) |
|---|---|
| Jan 4, 1950 | 20 |
| Apr 19, 2013 | 19.83 |
| Feb 25, 1985 | 19.5 |
| Mar 14, 1982 | 19.39 |
| Dec 31, 1990 | 18.98 |
| Feb 7, 2008 | 18.91 |
| Jul 17, 1996 | 18.77 |
| Feb 11, 1959 | 18.43 |
| Jun 17, 2015 | 18.38 |
| Jan 24, 1999 | 18.18 |
| Dec 9, 1966 | 18.07 |
| Jan 31, 1969 | 18.01 |
| Jun 1, 1991 | 17.86 |
| Jun 4, 1989 | 17.83 |
| May 27, 2011 | 17.76 |
| Jan 14, 2005 | 17.44 |
| Mar 11, 2009 | 17.12 |
| Feb 23, 1990 | 16.96 |
| Jun 14, 2004 | 16.92 |
| Apr 29, 1959 | 16.9 |
Data provided by the National Weather Service.