St. Joseph River (OH/IN) near Newville
Critical Stages
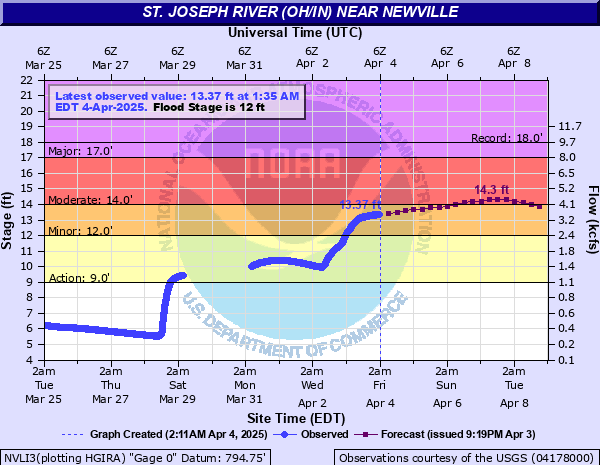
9' - Action
12' - Flood
14' - Moderate
17' - Major
Latest Observation
Updated: 7:03 PM LMT 12/31/00
Status: Obs Not Current
Stage: -999 ft
Flow: -999 kcfs
Forecast
Forecast not available for this location.
| Time | Stage (ft) | Flow (kcfs) |
|---|---|---|
| 5:10 AM 12/12 | 3.7 | 0.084 |
| 5:05 AM 12/12 | 3.7 | 0.084 |
| 5:00 AM 12/12 | 3.7 | 0.084 |
| 4:55 AM 12/12 | 3.7 | 0.084 |
| 4:50 AM 12/12 | 3.7 | 0.084 |
| 4:45 AM 12/12 | 3.7 | 0.084 |
| 4:40 AM 12/12 | 3.7 | 0.084 |
| 4:35 AM 12/12 | 3.7 | 0.084 |
| 4:30 AM 12/12 | 3.7 | 0.084 |
| 4:25 AM 12/12 | 3.7 | 0.084 |
| 4:20 AM 12/12 | 3.7 | 0.084 |
| 4:15 AM 12/12 | 3.7 | 0.084 |
| 4:10 AM 12/12 | 3.7 | 0.084 |
| 4:05 AM 12/12 | 3.7 | 0.084 |
| 4:00 AM 12/12 | 3.7 | 0.084 |
| 3:55 AM 12/12 | 3.7 | 0.084 |
| 3:50 AM 12/12 | 3.7 | 0.084 |
| 3:45 AM 12/12 | 3.7 | 0.084 |
| 3:40 AM 12/12 | 3.7 | 0.084 |
| 3:35 AM 12/12 | 3.7 | 0.084 |
| 3:30 AM 12/12 | 3.7 | 0.084 |
| 3:25 AM 12/12 | 3.7 | 0.084 |
| 3:20 AM 12/12 | 3.7 | 0.084 |
| 3:15 AM 12/12 | 3.7 | 0.084 |
| 3:05 AM 12/12 | 3.7 | 0.084 |
| 3:00 AM 12/12 | 3.7 | 0.084 |
| 2:55 AM 12/12 | 3.7 | 0.084 |
| 2:50 AM 12/12 | 3.7 | 0.084 |
| 2:45 AM 12/12 | 3.7 | 0.084 |
| 2:40 AM 12/12 | 3.7 | 0.084 |
19.3' -
Flood water begins to hit the bottom of the bridge at the gage site.
18' -
Record flooding is in progress and a few evacuations may be necessary. Many roads are flooded.
17' -
Residential flooding occurs in Leo, Indiana.
14' -
Significant flooding occurs on DeKalb County Road 42 about 3 miles northeast of Newville. Considerable agricultural and low land flooding occurs along the St. Joseph River to the Cedarville Reservoir.
12' -
DeKalb County Road 42 about 3 miles northeast of Newville floods. Agricultural and low lands flood along the St. Joseph River to the Cedarville Reservoir.
11' -
Minor agricultural and lowland flooding begins.
9' -
The river is at bankfull.
| Date | Stage (ft) |
|---|---|
| Mar 12, 2009 | 17.98 |
| Mar 17, 1982 | 17.96 |
| May 18, 1996 | 17.78 |
| Feb 26, 1985 | 17.22 |
| Apr 6, 1950 | 17.05 |
| May 1, 1956 | 16.89 |
| Dec 2, 2011 | 16.61 |
| Mar 24, 1978 | 16.61 |
| Jun 4, 1989 | 16.57 |
| Feb 23, 2018 | 16.45 |
| Jan 6, 1993 | 16.33 |
| May 24, 2010 | 15.99 |
| Jan 1, 1991 | 15.9 |
| May 15, 2002 | 15.72 |
| Feb 13, 2001 | 15.71 |
| Feb 8, 2008 | 15.7 |
| Jan 11, 2008 | 15.67 |
| Feb 18, 1976 | 15.67 |
| Feb 1, 1969 | 15.54 |
| May 21, 2020 | 15.46 |
Data provided by the National Weather Service.