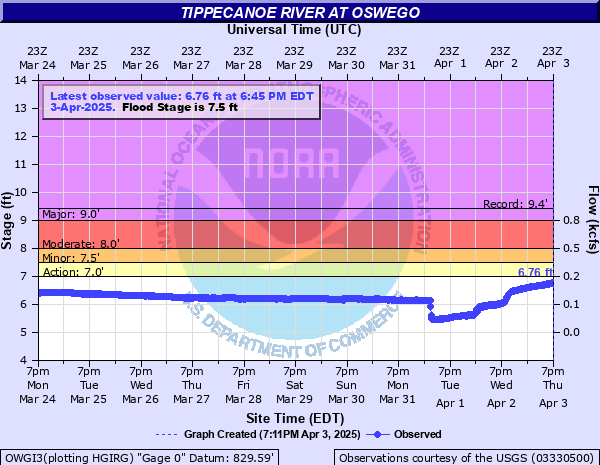
Tippecanoe River at Oswego
Critical Stages
7' - Action
7.5' - Flood
8' - Moderate
9' - Major
Latest Observation
Updated: 9:45 PM EST 12/14/25
Status: No Flooding
Stage: 5.18 ft
Flow: 0.0316 kcfs
Forecast
Forecast not available for this location.
| Time | Stage (ft) | Flow (kcfs) |
|---|---|---|
| 9:45 PM 12/14 | 5.18 | 0.0316 |
| 9:30 PM 12/14 | 5.18 | 0.0316 |
| 9:15 PM 12/14 | 5.17 | 0.031 |
| 9:00 PM 12/14 | 5.18 | 0.0316 |
| 8:45 PM 12/14 | 5.18 | 0.0316 |
| 8:30 PM 12/14 | 5.18 | 0.0316 |
| 8:15 PM 12/14 | 5.17 | 0.031 |
| 8:00 PM 12/14 | 5.18 | 0.0316 |
| 7:45 PM 12/14 | 5.18 | 0.0316 |
| 7:30 PM 12/14 | 5.18 | 0.0316 |
| 7:15 PM 12/14 | 5.18 | 0.0316 |
| 7:00 PM 12/14 | 5.18 | 0.0316 |
| 6:45 PM 12/14 | 5.18 | 0.0316 |
| 6:30 PM 12/14 | 5.17 | 0.031 |
| 6:15 PM 12/14 | 5.17 | 0.031 |
| 6:00 PM 12/14 | 5.18 | 0.0316 |
| 5:45 PM 12/14 | 5.18 | 0.0316 |
| 5:30 PM 12/14 | 5.18 | 0.0316 |
| 5:15 PM 12/14 | 5.18 | 0.0316 |
| 5:00 PM 12/14 | 5.18 | 0.0316 |
| 4:45 PM 12/14 | 5.18 | 0.0316 |
| 4:30 PM 12/14 | 5.18 | 0.0316 |
| 4:15 PM 12/14 | 5.18 | 0.0316 |
| 4:00 PM 12/14 | 5.18 | 0.0316 |
| 3:45 PM 12/14 | 5.18 | 0.0316 |
| 3:30 PM 12/14 | 5.18 | 0.0316 |
| 3:15 PM 12/14 | 5.18 | 0.0316 |
| 3:00 PM 12/14 | 5.18 | 0.0316 |
| 2:45 PM 12/14 | 5.18 | 0.0316 |
| 2:30 PM 12/14 | 5.18 | 0.0316 |
9' -
Flood water begins to innundate structures downstream of Lake Tippecanoe along the river.
8' -
Flood water begins to impact roads near the river downstream from Lake Tippecanoe.
7.5' -
Lowland flooding begins near the gauge downstream of Lake Tippecanoe.
| Date | Stage (ft) |
|---|---|
| May 21, 1943 | 9.4 |
| Mar 21, 1982 | 9.25 |
| Mar 15, 2009 | 8.96 |
| Mar 4, 1985 | 8.89 |
| Feb 27, 2018 | 8.79 |
| Jan 3, 1991 | 8.72 |
| Apr 26, 2013 | 8.69 |
| Jun 22, 1981 | 8.65 |
| Oct 17, 1954 | 8.64 |
| Apr 10, 1950 | 8.62 |
| Feb 10, 2008 | 8.54 |
| Jan 13, 2008 | 8.51 |
| Jan 10, 1993 | 8.48 |
| Feb 18, 1959 | 8.48 |
| Dec 8, 2011 | 8.48 |
| Mar 28, 1978 | 8.46 |
| Jan 12, 1998 | 8.35 |
| May 23, 2020 | 8.31 |
| Dec 16, 1966 | 8.25 |
| Feb 5, 1969 | 8.21 |
Data provided by the National Weather Service.