Yellow River at Plymouth
Critical Stages
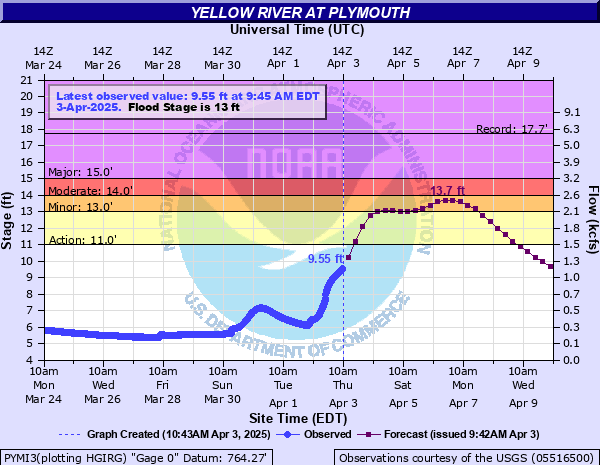
11' - Action
13' - Flood
14' - Moderate
15' - Major
Latest Observation
Updated: 9:45 PM EST 12/14/25
Status: No Flooding
Stage: 5.05 ft
Flow: 0.15 kcfs
Forecast
Forecast not available for this location.
| Time | Stage (ft) | Flow (kcfs) |
|---|---|---|
| 9:45 PM 12/14 | 5.05 | 0.15 |
| 9:30 PM 12/14 | 5.05 | 0.15 |
| 9:15 PM 12/14 | 5.04 | 0.149 |
| 9:00 PM 12/14 | 5.05 | 0.15 |
| 8:45 PM 12/14 | 5.05 | 0.15 |
| 8:30 PM 12/14 | 5.05 | 0.15 |
| 8:15 PM 12/14 | 5.04 | 0.149 |
| 8:00 PM 12/14 | 5.05 | 0.15 |
| 7:45 PM 12/14 | 5.05 | 0.15 |
| 7:30 PM 12/14 | 5.05 | 0.15 |
| 7:15 PM 12/14 | 5.05 | 0.15 |
| 7:00 PM 12/14 | 5.05 | 0.15 |
| 6:45 PM 12/14 | 5.05 | 0.15 |
| 6:30 PM 12/14 | 5.05 | 0.15 |
| 6:15 PM 12/14 | 5.05 | 0.15 |
| 6:00 PM 12/14 | 5.05 | 0.15 |
| 5:45 PM 12/14 | 5.05 | 0.15 |
| 5:30 PM 12/14 | 5.06 | 0.152 |
| 5:15 PM 12/14 | 5.06 | 0.152 |
| 5:00 PM 12/14 | 5.06 | 0.152 |
| 4:45 PM 12/14 | 5.07 | 0.153 |
| 4:30 PM 12/14 | 5.07 | 0.153 |
| 4:15 PM 12/14 | 5.08 | 0.155 |
| 4:00 PM 12/14 | 5.08 | 0.155 |
| 3:45 PM 12/14 | 5.08 | 0.155 |
| 3:30 PM 12/14 | 5.08 | 0.155 |
| 3:15 PM 12/14 | 5.08 | 0.155 |
| 3:00 PM 12/14 | 5.08 | 0.155 |
| 2:45 PM 12/14 | 5.08 | 0.155 |
| 2:30 PM 12/14 | 5.08 | 0.155 |
17' -
There are extensive flooding problems throughout Plymouth.
16' -
Residential areas and high school property flood. Water from 1 to 3 feet deep affects southern and eastern sections of the city.
15' -
Flooding begins of commercial property along Laporte and Garro Streets.
14.5' -
The parking lot on Laporte Street begins to flood.
14' -
A small trailer park near the Jefferson Street bridge begins to flood.
13.5' -
Some residential and commercial properties near the Jefferson Street Bridge begin to flood.
13' -
The right bank of the Yellow River overflows with some city streets...low lying county roads and back yards along Laporte Street in Plymouth flooding. Low lying agricultural areas flood as well.
| Date | Stage (ft) |
|---|---|
| Feb 22, 2018 | 17.73 |
| Oct 12, 1954 | 17.13 |
| Mar 16, 1982 | 16.37 |
| Feb 26, 1985 | 15.68 |
| Jan 1, 1991 | 15.3 |
| Jan 10, 2008 | 15.12 |
| Mar 24, 1978 | 15.01 |
| Mar 12, 2009 | 14.72 |
| Jan 15, 2005 | 14.67 |
| Feb 12, 2001 | 14.37 |
| Jan 6, 1993 | 14.25 |
| Mar 6, 1979 | 14.23 |
| Jul 21, 1996 | 13.96 |
| May 14, 2002 | 13.76 |
| Feb 23, 1997 | 13.7 |
| Apr 20, 2013 | 13.68 |
| May 2, 2019 | 13.53 |
| Feb 4, 1968 | 13.48 |
| Dec 27, 1965 | 13.44 |
| Jul 12, 1951 | 13.39 |
Data provided by the National Weather Service.