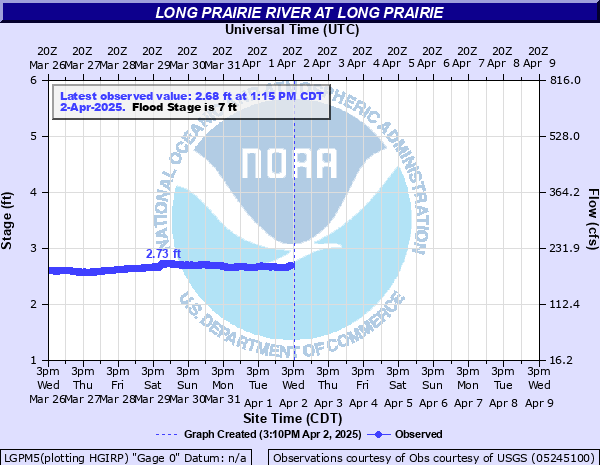
Long Prairie River at Long Prairie
Critical Stages
6' - Action
7' - Flood
8' - Moderate
10' - Major
Latest Observation
Updated: 12:15 AM CST 12/8/25
Status: No Flooding
Stage: 0.24 ft
Flow: -999 kcfs
Forecast
Forecast not available for this location.
| Time | Stage (ft) | Flow (kcfs) |
|---|---|---|
| 12:15 AM 12/8 | 0.24 | -999 |
| 12:00 AM 12/8 | 0.24 | -999 |
| 11:45 PM 12/7 | 0.24 | -999 |
| 11:30 PM 12/7 | 0.24 | -999 |
| 11:15 PM 12/7 | 0.24 | -999 |
| 11:00 PM 12/7 | 0.24 | -999 |
| 10:45 PM 12/7 | 0.24 | -999 |
| 10:30 PM 12/7 | 0.24 | -999 |
| 10:15 PM 12/7 | 0.24 | -999 |
| 10:00 PM 12/7 | 0.24 | -999 |
| 9:45 PM 12/7 | 0.24 | -999 |
| 9:30 PM 12/7 | 0.24 | -999 |
| 9:15 PM 12/7 | 0.24 | -999 |
| 9:00 PM 12/7 | 0.24 | -999 |
| 8:45 PM 12/7 | 0.24 | -999 |
| 8:30 PM 12/7 | 0.24 | -999 |
| 8:15 PM 12/7 | 0.24 | -999 |
| 8:00 PM 12/7 | 0.24 | -999 |
| 7:45 PM 12/7 | 0.24 | -999 |
| 7:30 PM 12/7 | 0.24 | -999 |
| 7:15 PM 12/7 | 0.24 | -999 |
| 7:00 PM 12/7 | 0.24 | -999 |
| 6:45 PM 12/7 | 0.24 | -999 |
| 6:30 PM 12/7 | 0.24 | -999 |
| 6:15 PM 12/7 | 0.24 | -999 |
| 6:00 PM 12/7 | 0.24 | -999 |
| 5:45 PM 12/7 | 0.24 | -999 |
| 5:30 PM 12/7 | 0.24 | -999 |
| 5:15 PM 12/7 | 0.24 | -999 |
| 5:00 PM 12/7 | 0.24 | -999 |
10.9' -
Water reaches low bridge steel on Riverside Drive bridge just below gage.
9.3' -
Water begins to flow over Riverside Drive west of the bridge.
9.2' -
Water begins to flow over Highway 71 about 2000 feet north of Highway 27.
8' -
Commercial businesses are impacted on Riverside Drive and 1st Avenue SW. Sandbags deployed to protect commercial structures.
7' -
1st Avenue SW becomes innundated. Lumber yard and produce store parking lots flood due to water backing up Venewitz Creek. Lions Westside park impacted.
6' -
Low area north side of the river across from Lions Westside Park partially inundated.
5' -
Canoe Landing at Riverside Park starts to flood.
| Date | Stage (ft) |
|---|---|
| Jul 22, 1972 | 9.37 |
| Apr 9, 2001 | 8.91 |
| Jun 26, 2003 | 8.78 |
| Apr 8, 1997 | 7.9 |
| Mar 26, 2009 | 7.58 |
| Apr 14, 2023 | 7.56 |
| Apr 20, 1979 | 7.55 |
| Apr 5, 1982 | 7.54 |
| Mar 28, 2019 | 7.29 |
| Apr 1, 1986 | 7.1 |
| Mar 17, 2010 | 7.09 |
| May 13, 2022 | 6.93 |
| Jun 9, 2014 | 6.8 |
| Apr 11, 1996 | 6.47 |
| Oct 20, 1984 | 6.41 |
| Apr 7, 2011 | 6.36 |
| Apr 3, 2006 | 6.34 |
| Mar 18, 1995 | 6.31 |
| Apr 22, 1975 | 6.25 |
| Feb 22, 2017 | 6.25 |
Data provided by the National Weather Service.