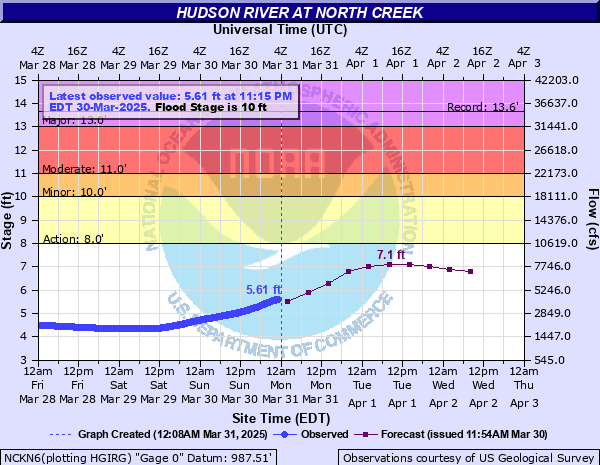
Hudson River at North Creek
Critical Stages
8' - Action
10' - Flood
11' - Moderate
13' - Major
Latest Observation
Updated: 8:15 PM EST 12/15/25
Status: No Flooding
Stage: 3.07 ft
Flow: 0.593 kcfs
Forecast
| Time | Stage (ft) | Flow (kcfs) |
|---|---|---|
| 1 AM 12/16 | 3 | 0.545 |
| 7 AM 12/16 | 3 | 0.545 |
| 1 PM 12/16 | 3 | 0.545 |
| 7 PM 12/16 | 3 | 0.545 |
| 1 AM 12/17 | 3 | 0.545 |
| 7 AM 12/17 | 3 | 0.545 |
| 1 PM 12/17 | 3 | 0.545 |
| 7 PM 12/17 | 3 | 0.545 |
| 1 AM 12/18 | 3 | 0.545 |
| 7 AM 12/18 | 3 | 0.545 |
| Time | Stage (ft) | Flow (kcfs) |
|---|---|---|
| 8:15 PM 12/15 | 3.07 | 0.593 |
| 8:00 PM 12/15 | 3.07 | 0.593 |
| 7:45 PM 12/15 | 3.07 | 0.593 |
| 7:30 PM 12/15 | 3.07 | 0.593 |
| 7:15 PM 12/15 | 3.08 | 0.6 |
| 7:00 PM 12/15 | 3.07 | 0.593 |
| 6:45 PM 12/15 | 3.07 | 0.593 |
| 6:30 PM 12/15 | 3.07 | 0.593 |
| 6:15 PM 12/15 | 3.07 | 0.593 |
| 6:00 PM 12/15 | 3.06 | 0.586 |
| 5:45 PM 12/15 | 3.06 | 0.586 |
| 5:30 PM 12/15 | 3.07 | 0.593 |
| 5:15 PM 12/15 | 3.07 | 0.593 |
| 5:00 PM 12/15 | 3.07 | 0.593 |
| 4:45 PM 12/15 | 3.07 | 0.593 |
| 4:30 PM 12/15 | 3.07 | 0.593 |
| 4:15 PM 12/15 | 3.07 | 0.593 |
| 4:00 PM 12/15 | 3.07 | 0.593 |
| 3:45 PM 12/15 | 3.08 | 0.6 |
| 3:30 PM 12/15 | 3.08 | 0.6 |
| 3:15 PM 12/15 | 3.08 | 0.6 |
| 3:00 PM 12/15 | 3.07 | 0.593 |
| 2:45 PM 12/15 | 3.07 | 0.593 |
| 2:30 PM 12/15 | 3.06 | 0.586 |
| 2:15 PM 12/15 | 3.06 | 0.586 |
| 2:00 PM 12/15 | 3.05 | 0.579 |
| 1:45 PM 12/15 | 3.05 | 0.579 |
| 1:30 PM 12/15 | 3.05 | 0.579 |
| 1:15 PM 12/15 | 3.06 | 0.586 |
| 1:00 PM 12/15 | 3.06 | 0.586 |
13' -
Water reaches major flood stage. Several hundred feet of railroad tracks are inundated with two to five feet of water. Most of Old River Road is water covered.
11.5' -
Water reaches Old River Road in the Town of Chester and crosses the road in two locations.
11' -
Water reaches moderate flood stage. State Route 28 in North River has about half a foot of water across it. Carpenter's Field is inundated.
10' -
Water reaches minor flood stage and inundates low areas including portions of Old River Road upstream of the Route 28N bridge.
8' -
The river is at action stage.
| Date | Stage (ft) |
|---|---|
| Apr 29, 2011 | 13.65 |
| Mar 12, 2011 | 12.19 |
| Dec 31, 1948 | 12.14 |
| Mar 19, 1936 | 12.1 |
| Nov 1, 2019 | 11.83 |
| Mar 27, 1913 | 11.7 |
| Jan 9, 1998 | 11.54 |
| Apr 16, 2014 | 11.54 |
| Jun 3, 1947 | 11.37 |
| Apr 28, 1979 | 11.3 |
| Dec 19, 2023 | 11.08 |
| Oct 7, 1932 | 10.7 |
| May 3, 1972 | 10.63 |
| Apr 21, 2019 | 10.56 |
| Apr 1, 1976 | 10.54 |
| Apr 17, 1993 | 10.27 |
| Apr 1, 1986 | 10.1 |
| Apr 1, 1987 | 10.1 |
| Dec 30, 1984 | 9.92 |
| Oct 22, 1995 | 9.91 |
Data provided by the National Weather Service.