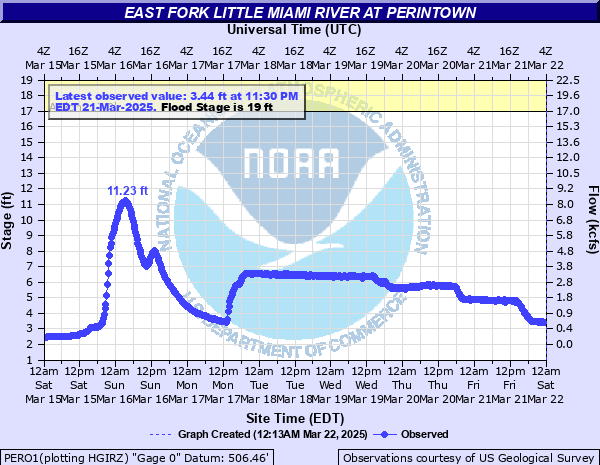
East Fork Little Miami River at Perintown
Critical Stages
17' - Action
19' - Flood
22' - Moderate
24' - Major
Latest Observation
Updated: 9:30 AM EST 12/14/25
Status: No Flooding
Stage: 2.61 ft
Flow: 0.177 kcfs
Forecast
Forecast not available for this location.
| Time | Stage (ft) | Flow (kcfs) |
|---|---|---|
| 10:00 AM 12/14 | 2.61 | 0.177 |
| 9:45 AM 12/14 | 2.59 | 0.168 |
| 9:30 AM 12/14 | 2.61 | 0.177 |
| 9:15 AM 12/14 | 2.58 | 0.163 |
| 9:00 AM 12/14 | 2.6 | 0.172 |
| 8:45 AM 12/14 | 2.6 | 0.172 |
| 8:30 AM 12/14 | 2.62 | 0.181 |
| 8:15 AM 12/14 | 2.62 | 0.181 |
| 8:00 AM 12/14 | 2.62 | 0.181 |
| 7:45 AM 12/14 | 2.62 | 0.181 |
| 7:30 AM 12/14 | 2.62 | 0.181 |
| 7:15 AM 12/14 | 2.62 | 0.181 |
| 7:00 AM 12/14 | 2.63 | 0.184 |
| 6:45 AM 12/14 | 2.63 | 0.184 |
| 6:30 AM 12/14 | 2.63 | 0.184 |
| 6:15 AM 12/14 | 2.63 | 0.184 |
| 6:00 AM 12/14 | 2.64 | 0.188 |
| 5:45 AM 12/14 | 2.64 | 0.188 |
| 5:30 AM 12/14 | 2.64 | 0.188 |
| 5:15 AM 12/14 | 2.65 | 0.191 |
| 5:00 AM 12/14 | 2.65 | 0.191 |
| 4:45 AM 12/14 | 2.65 | 0.191 |
| 4:30 AM 12/14 | 2.65 | 0.191 |
| 4:15 AM 12/14 | 2.65 | 0.191 |
| 4:00 AM 12/14 | 2.66 | 0.195 |
| 3:45 AM 12/14 | 2.66 | 0.195 |
| 3:30 AM 12/14 | 2.66 | 0.195 |
| 3:15 AM 12/14 | 2.67 | 0.199 |
| 3:00 AM 12/14 | 2.67 | 0.199 |
| 2:45 AM 12/14 | 2.67 | 0.199 |
25' -
Flooding worsens along roads near the East Fork of the Little Miami River in central Clermont County.
23' -
Flooding occurs along Binning Road near Shaler Creek, as well as along low-lying roads along the river east of I-275.
20' -
Flooding occurs along low-lying roads near Route 50 north of the river.
19' -
Mainly lowland flooding occurs along the East Fork of the Little Miami River south of Route 50.
| Date | Stage (ft) |
|---|---|
| Mar 10, 1964 | 23.84 |
| Mar 6, 1945 | 23.42 |
| Mar 19, 1933 | 22.68 |
| Mar 19, 1943 | 22.3 |
| Apr 2, 1970 | 21.87 |
| May 24, 1968 | 21.87 |
| Apr 4, 1957 | 20.7 |
| May 10, 2003 | 20.32 |
| May 27, 1968 | 20 |
| Apr 19, 1940 | 19.95 |
| Apr 20, 1920 | 19.77 |
| Feb 14, 1948 | 19.65 |
| Feb 14, 1926 | 18 |
| May 17, 1990 | 17.87 |
| Jan 19, 1927 | 17.6 |
| Dec 17, 1915 | 17.3 |
| Jun 16, 2019 | 16.91 |
| Feb 17, 2022 | 16.78 |
| Jun 18, 1997 | 16.45 |
| Jan 28, 1953 | 16.17 |
Data provided by the National Weather Service.