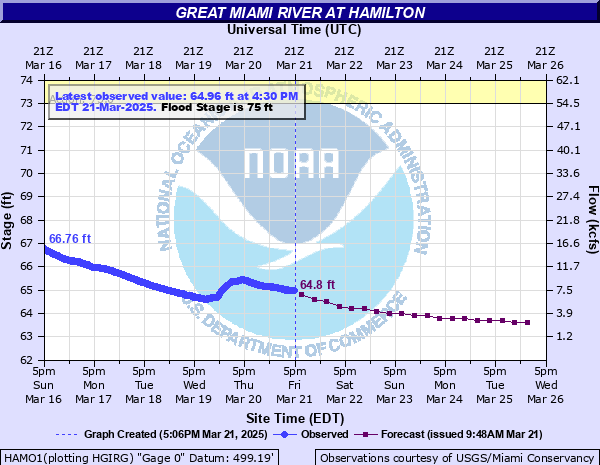
Great Miami River at Hamilton
Critical Stages
73' - Action
75' - Flood
82' - Moderate
89.5' - Major
Latest Observation
Updated: 5:45 PM EST 12/15/25
Status: No Flooding
Stage: 62.87 ft
Flow: 0.966 kcfs
Forecast
| Time | Stage (ft) | Flow (kcfs) |
|---|---|---|
| 7 PM 12/15 | 62.8 | 0.828 |
| 1 AM 12/16 | 62.8 | 0.828 |
| 7 AM 12/16 | 62.8 | 0.828 |
| 1 PM 12/16 | 62.8 | 0.828 |
| 7 PM 12/16 | 62.8 | 0.828 |
| 1 AM 12/17 | 62.8 | 0.828 |
| 7 AM 12/17 | 62.8 | 0.828 |
| 1 PM 12/17 | 62.7 | 0.647 |
| 7 PM 12/17 | 62.7 | 0.647 |
| 1 AM 12/18 | 62.7 | 0.647 |
| 7 AM 12/18 | 62.8 | 0.828 |
| 1 PM 12/18 | 62.8 | 0.828 |
| 7 PM 12/18 | 63 | 1.24 |
| 1 AM 12/19 | 63.1 | 1.47 |
| 7 AM 12/19 | 63.2 | 1.68 |
| 1 PM 12/19 | 63.3 | 1.9 |
| 7 PM 12/19 | 63.2 | 1.68 |
| 1 AM 12/20 | 63.2 | 1.68 |
| 7 AM 12/20 | 63.1 | 1.47 |
| Time | Stage (ft) | Flow (kcfs) |
|---|---|---|
| 6:00 PM 12/15 | 62.87 | 0.966 |
| 5:45 PM 12/15 | 62.87 | 0.966 |
| 5:30 PM 12/15 | 62.87 | 0.966 |
| 5:15 PM 12/15 | 62.87 | 0.966 |
| 5:00 PM 12/15 | 62.87 | 0.966 |
| 4:45 PM 12/15 | 62.87 | 0.966 |
| 4:30 PM 12/15 | 62.87 | 0.966 |
| 4:15 PM 12/15 | 62.87 | 0.966 |
| 4:00 PM 12/15 | 62.87 | 0.966 |
| 3:45 PM 12/15 | 62.87 | 0.966 |
| 3:30 PM 12/15 | 62.87 | 0.966 |
| 3:15 PM 12/15 | 62.87 | 0.966 |
| 3:00 PM 12/15 | 62.86 | 0.948 |
| 2:45 PM 12/15 | 62.86 | 0.948 |
| 2:30 PM 12/15 | 62.86 | 0.948 |
| 2:15 PM 12/15 | 62.86 | 0.948 |
| 2:00 PM 12/15 | 62.86 | 0.948 |
| 1:45 PM 12/15 | 62.86 | 0.948 |
| 1:30 PM 12/15 | 62.86 | 0.948 |
| 1:15 PM 12/15 | 62.86 | 0.948 |
| 1:00 PM 12/15 | 62.86 | 0.948 |
| 12:45 PM 12/15 | 62.86 | 0.948 |
| 12:30 PM 12/15 | 62.86 | 0.948 |
| 12:15 PM 12/15 | 62.86 | 0.948 |
| 12:00 PM 12/15 | 62.86 | 0.948 |
| 11:45 AM 12/15 | 62.85 | 0.929 |
| 11:30 AM 12/15 | 62.85 | 0.929 |
| 11:15 AM 12/15 | 62.86 | 0.948 |
| 11:00 AM 12/15 | 62.86 | 0.948 |
| 10:45 AM 12/15 | 62.85 | 0.929 |
90' -
Water would overtop levees on the south side of Hamilton. Water levels exceeding 90 feet would top all levees protecting the business district resulting in major flooding near the river channel through the entire city. Major flooding occurs, especially near New Miami and Ross, where homes and businesses along the river are suffering major inundation.
89' -
This elevation is at the top of some levees protecting mainly the southern areas of Hamilton. In addition to major inundation of communities such as New Miami and near Ross, river stages above this level would inundate some areas of Hamilton south of Pershing Avenue along and near Neilan Boulevard. Widespread inundation occurs near Joyce Park and Joe Nuxhall Lane.
84' -
Flooding worsens in lowland areas in southern Butler County between State Route 128 and the Great Miami River. Flooding also worsens along the river near Ross. The City of Hamilton itself is protected from river flooding up to 89 feet for locations in the southern part of the city, with most of the city protected at stages up to 90 feet.
82' -
Lowland areas in southern Butler County between State Route 128 and the Great Miami River become flooded. Flooding also occurs along the river near Ross. The City of Hamilton itself is protected from river levels up to 89 feet in the southern sections of the city, while most of the city is protected up to 90 feet.
77' -
Locations along the river mainly south of the City of Hamilton become flooded. Flooding continues to impact New Miami and Ross. Southern portions of the City of Hamilton are protected by flood walls up to 89 feet, with the majority of the city protected up to a stage of 90 feet.
75' -
Lowland areas south of Hamilton to Ross continue to flood. Evacuations are possible near New Miami and near Ross. The City of Hamilton itself is protected from river levels up to 89 feet for locations in the southern part of the city, with most of the city protected at stages up to 90 feet.
74' -
Lowland flooding begins about one mile north of High Street in Hamilton and near Ross, about five miles downstream. Low-lying homes near New Miami and other low-lying areas along the river channel are impacted. The City of Hamilton itself is protected from river levels up to 89 feet for locations in the southern part of the city, with most of the city protected at stages up to 90 feet.
| Date | Stage (ft) |
|---|---|
| Jan 21, 1959 | 79.2 |
| Mar 19, 1943 | 76.6 |
| Feb 26, 1929 | 76.5 |
| Jan 22, 1937 | 76.33 |
| Jan 27, 1952 | 75.95 |
| Jan 5, 2004 | 75.84 |
| Jan 6, 2005 | 75.57 |
| May 24, 1968 | 75.41 |
| Mar 19, 2008 | 75.15 |
| Mar 5, 1963 | 74.96 |
| Jan 6, 1949 | 74.5 |
| Jan 6, 1945 | 74.5 |
| Apr 29, 1996 | 74.26 |
| Jan 31, 1982 | 73.75 |
| Apr 5, 2025 | 73.53 |
| May 8, 1961 | 73.42 |
| Jan 14, 2005 | 72.87 |
| Jan 24, 1949 | 72.65 |
| Aug 10, 1995 | 72.1 |
Data provided by the National Weather Service.