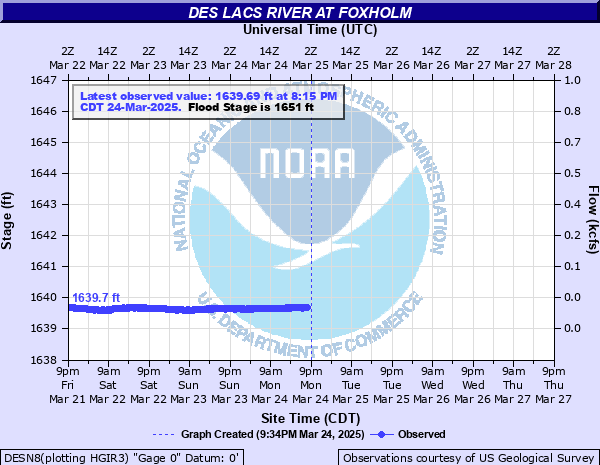
Des Lacs River at Foxholm
Critical Stages
1650' - Action
1651' - Flood
1653' - Moderate
1654' - Major
Latest Observation
Updated: 2:15 PM CST 12/15/25
Status: No Flooding
Stage: 1639.68 ft
Flow: 0.0001 kcfs
Forecast
Forecast not available for this location.
| Time | Stage (ft) | Flow (kcfs) |
|---|---|---|
| 2:15 PM 12/15 | 1639.68 | 0.0001 |
| 2:00 PM 12/15 | 1639.69 | 0.0003 |
| 1:45 PM 12/15 | 1639.68 | 0.0001 |
| 1:30 PM 12/15 | 1639.69 | 0.0003 |
| 12:15 PM 12/15 | 1639.7 | 0.001 |
| 12:00 PM 12/15 | 1639.7 | 0.001 |
| 11:45 AM 12/15 | 1639.71 | 0.001 |
| 11:30 AM 12/15 | 1639.7 | 0.001 |
| 11:15 AM 12/15 | 1639.71 | 0.001 |
| 11:00 AM 12/15 | 1639.71 | 0.001 |
| 10:45 AM 12/15 | 1639.72 | 0.001 |
| 10:30 AM 12/15 | 1639.71 | 0.001 |
| 10:15 AM 12/15 | 1639.71 | 0.001 |
| 10:00 AM 12/15 | 1639.72 | 0.001 |
| 9:45 AM 12/15 | 1639.72 | 0.001 |
| 9:30 AM 12/15 | 1639.72 | 0.001 |
| 9:15 AM 12/15 | 1639.72 | 0.001 |
| 9:00 AM 12/15 | 1639.72 | 0.001 |
| 8:45 AM 12/15 | 1639.71 | 0.001 |
| 8:30 AM 12/15 | 1639.71 | 0.001 |
| 8:15 AM 12/15 | 1639.71 | 0.001 |
| 8:00 AM 12/15 | 1639.71 | 0.001 |
| 7:45 AM 12/15 | 1639.7 | 0.001 |
| 7:30 AM 12/15 | 1639.69 | 0.0003 |
| 7:15 AM 12/15 | 1639.69 | 0.0003 |
| 7:00 AM 12/15 | 1639.68 | 0.0001 |
| 6:45 AM 12/15 | 1639.69 | 0.0003 |
| 6:30 AM 12/15 | 1639.68 | 0.0001 |
| 6:15 AM 12/15 | 1639.68 | 0.0001 |
| 6:00 AM 12/15 | 1639.68 | 0.0001 |
1655.5' -
Floor of bridge just downstream of gage house will be flooded.
1654.2' -
Highway 52 between carpio and burlington will be closed. Valley floor under water. Homes lowest in elevation in Foxholm are likely flooded if not protected.
1653' -
Homes in Foxholm close to the Des Lacs can be affected as water encroaches on them. Lower elevation homes along Project Road near Burlington suffer damage even with no releases from Lake Darling.
1652.5' -
Average height of ground around gage house.
| Date | Stage (ft) |
|---|---|
| Apr 19, 1979 | 1655.29 |
| Apr 30, 1970 | 1654.77 |
| Jun 1, 2011 | 1654.63 |
| Apr 10, 1969 | 1653.88 |
| Jun 5, 2013 | 1653.69 |
| Apr 10, 1996 | 1653.22 |
| Apr 29, 1975 | 1653.12 |
| Jan 1, 1939 | 1652.86 |
| Apr 13, 2009 | 1652.23 |
| Apr 6, 1951 | 1652.11 |
| Apr 4, 1949 | 1652.1 |
| Mar 24, 1976 | 1650.67 |
| Mar 27, 2017 | 1649.21 |
| Mar 16, 1972 | 1649.08 |
| Jun 27, 2005 | 1648.96 |
| Mar 27, 1960 | 1648.7 |
| Mar 30, 2005 | 1648.633 |
| Jul 16, 1999 | 1648.48 |
| Apr 22, 2018 | 1648.47 |
| Mar 24, 1947 | 1648.44 |
Data provided by the National Weather Service.