Souris River near Foxholm
Critical Stages
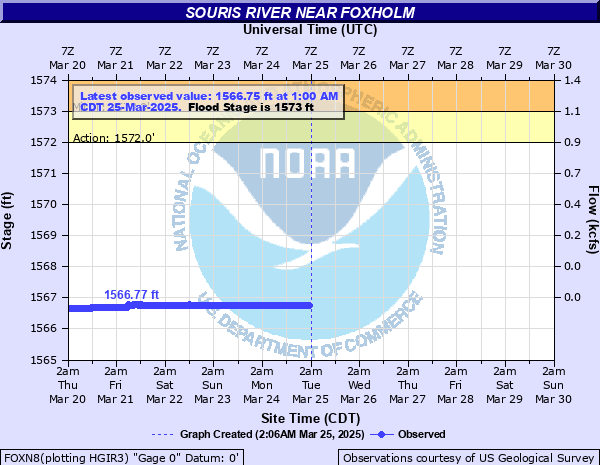
1572' - Action
1573' - Flood
1576' - Moderate
1578' - Major
Latest Observation
Updated: 2:00 PM CST 12/15/25
Status: No Flooding
Stage: 1566.81 ft
Flow: 0 kcfs
Forecast
Forecast not available for this location.
| Time | Stage (ft) | Flow (kcfs) |
|---|---|---|
| 2:00 PM 12/15 | 1566.81 | 0 |
| 1:45 PM 12/15 | 1566.81 | 0 |
| 1:30 PM 12/15 | 1566.81 | 0 |
| 1:15 PM 12/15 | 1566.82 | 0 |
| 1:00 PM 12/15 | 1566.82 | 0 |
| 12:45 PM 12/15 | 1566.82 | 0 |
| 12:30 PM 12/15 | 1566.82 | 0 |
| 12:15 PM 12/15 | 1566.82 | 0 |
| 12:00 PM 12/15 | 1566.82 | 0 |
| 11:45 AM 12/15 | 1566.82 | 0 |
| 11:30 AM 12/15 | 1566.82 | 0 |
| 11:15 AM 12/15 | 1566.83 | 0 |
| 11:00 AM 12/15 | 1566.83 | 0 |
| 10:45 AM 12/15 | 1566.83 | 0 |
| 10:30 AM 12/15 | 1566.83 | 0 |
| 10:15 AM 12/15 | 1566.83 | 0 |
| 10:00 AM 12/15 | 1566.83 | 0 |
| 9:45 AM 12/15 | 1566.83 | 0 |
| 9:30 AM 12/15 | 1566.83 | 0 |
| 9:15 AM 12/15 | 1566.83 | 0 |
| 9:00 AM 12/15 | 1566.83 | 0 |
| 8:45 AM 12/15 | 1566.83 | 0 |
| 8:30 AM 12/15 | 1566.83 | 0 |
| 8:15 AM 12/15 | 1566.83 | 0 |
| 8:00 AM 12/15 | 1566.83 | 0 |
| 7:45 AM 12/15 | 1566.82 | 0 |
| 7:30 AM 12/15 | 1566.82 | 0 |
| 7:15 AM 12/15 | 1566.82 | 0 |
| 7:00 AM 12/15 | 1566.82 | 0 |
| 6:45 AM 12/15 | 1566.82 | 0 |
1578.8' -
Something around 1578.5 to 1578.8 ft the County Road 8 closes as the water becomes to deep on the road and bridge surface.
1577.3' -
The road leading to the gage and Baker Bridge downstream of the gage house will flood. The valley floor becomes covered with water.
1576' -
West bank begins to overflow.
1575' -
Rural flooding begins.
1571' -
East bank begins to overflow.
| Date | Stage (ft) |
|---|---|
| Jun 25, 2011 | 1584.44 |
| Apr 17, 1976 | 1579.173 |
| Apr 17, 1969 | 1577.843 |
| May 23, 1975 | 1577.793 |
| May 9, 1979 | 1577.673 |
| Apr 23, 1974 | 1576.823 |
| May 16, 1948 | 1576.793 |
| Apr 22, 1982 | 1576.673 |
| May 19, 1970 | 1576.513 |
| Apr 25, 1943 | 1576.503 |
| Apr 21, 2013 | 1576.413 |
| Apr 18, 1999 | 1576.303 |
| Apr 6, 1997 | 1576.283 |
| Apr 21, 1955 | 1576.203 |
| Jul 7, 2014 | 1576.09 |
| Apr 14, 1951 | 1575.983 |
| May 6, 2001 | 1575.813 |
| Apr 22, 1956 | 1575.693 |
| Apr 4, 1972 | 1575.393 |
| Apr 28, 2001 | 1575.363 |
Data provided by the National Weather Service.