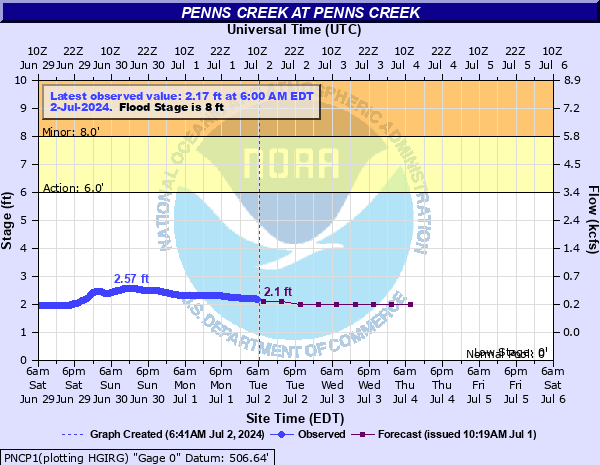
Penns Creek at Penns Creek
Critical Stages
6' - Action
8' - Flood
10' - Moderate
12' - Major
Latest Observation
Updated: 10:00 AM EST 12/14/25
Status: No Flooding
Stage: 1.4 ft
Flow: 0.068 kcfs
Forecast
| Time | Stage (ft) | Flow (kcfs) |
|---|---|---|
| 1 PM 12/14 | 1.3 | 0.054 |
| 7 PM 12/14 | 1.3 | 0.054 |
| 1 AM 12/15 | 1.3 | 0.054 |
| 7 AM 12/15 | 1.3 | 0.054 |
| 1 PM 12/15 | 1.3 | 0.054 |
| 7 PM 12/15 | 1.3 | 0.054 |
| 1 AM 12/16 | 1.3 | 0.054 |
| 7 AM 12/16 | 1.3 | 0.054 |
| 1 PM 12/16 | 1.3 | 0.054 |
| 7 PM 12/16 | 1.3 | 0.054 |
| 1 AM 12/17 | 1.3 | 0.054 |
| 7 AM 12/17 | 1.3 | 0.054 |
| Time | Stage (ft) | Flow (kcfs) |
|---|---|---|
| 10:00 AM 12/14 | 1.4 | 0.068 |
| 9:45 AM 12/14 | 1.4 | 0.068 |
| 9:30 AM 12/14 | 1.4 | 0.068 |
| 9:15 AM 12/14 | 1.41 | 0.0695 |
| 9:00 AM 12/14 | 1.42 | 0.071 |
| 8:45 AM 12/14 | 1.42 | 0.071 |
| 8:30 AM 12/14 | 1.42 | 0.071 |
| 8:15 AM 12/14 | 1.43 | 0.0726 |
| 8:00 AM 12/14 | 1.43 | 0.0726 |
| 7:45 AM 12/14 | 1.43 | 0.0726 |
| 7:30 AM 12/14 | 1.43 | 0.0726 |
| 7:15 AM 12/14 | 1.43 | 0.0726 |
| 7:00 AM 12/14 | 1.43 | 0.0726 |
| 6:45 AM 12/14 | 1.42 | 0.071 |
| 6:30 AM 12/14 | 1.42 | 0.071 |
| 6:15 AM 12/14 | 1.41 | 0.0695 |
| 6:00 AM 12/14 | 1.41 | 0.0695 |
| 5:45 AM 12/14 | 1.41 | 0.0695 |
| 5:30 AM 12/14 | 1.41 | 0.0695 |
| 5:15 AM 12/14 | 1.41 | 0.0695 |
| 5:00 AM 12/14 | 1.41 | 0.0695 |
| 4:45 AM 12/14 | 1.41 | 0.0695 |
| 4:30 AM 12/14 | 1.41 | 0.0695 |
| 4:15 AM 12/14 | 1.41 | 0.0695 |
| 4:00 AM 12/14 | 1.41 | 0.0695 |
| 3:45 AM 12/14 | 1.41 | 0.0695 |
| 3:30 AM 12/14 | 1.41 | 0.0695 |
| 3:15 AM 12/14 | 1.41 | 0.0695 |
| 3:00 AM 12/14 | 1.41 | 0.0695 |
| 2:45 AM 12/14 | 1.42 | 0.071 |
14' -
Widespread flooding occurs on both banks with many homes affected.
12' -
Significant overflow of both banks occurs. Numerous homes are affected by high water levels.
10' -
High water overflows both banks. Several homes and cottages on the left or north bank are affected. Many secondary roads along the creek are closed due to high water levels.
8' -
The left, or north bank overflows downstream of the Route 104 bridge. A campground is affected. A number of secondary roads in the Penns Creek drainage are affected by high water.
| Date | Stage (ft) |
|---|---|
| Jun 23, 1972 | 14.85 |
| Jan 19, 1996 | 13.74 |
| Feb 26, 1979 | 13 |
| Sep 16, 1934 | 13 |
| Sep 18, 2004 | 12.19 |
| Mar 18, 1936 | 12.12 |
| Feb 15, 1984 | 11.73 |
| Nov 25, 1950 | 11.62 |
| Mar 31, 1940 | 11.61 |
| Aug 24, 1933 | 11 |
| Mar 11, 1936 | 10.9 |
| Sep 24, 2021 | 10.9 |
| Mar 3, 1972 | 10.15 |
| May 23, 1942 | 10.14 |
| Mar 11, 2011 | 10.06 |
| Nov 2, 1956 | 9.88 |
| May 16, 2014 | 9.87 |
| May 27, 1946 | 9.79 |
| Jan 25, 1979 | 9.76 |
| Dec 1, 2010 | 9.73 |
Data provided by the National Weather Service.