« Back to Veterans Park Rivers
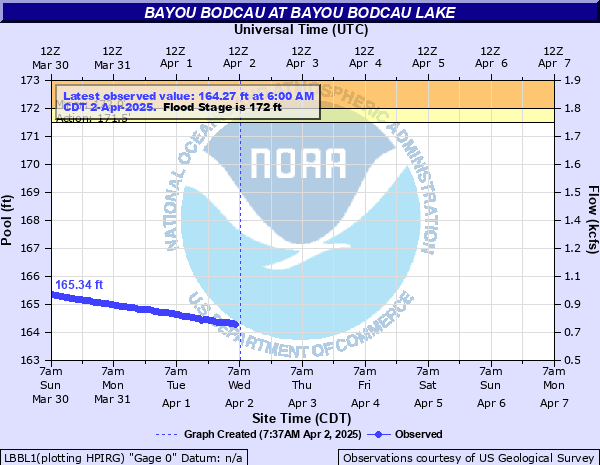
Bayou Bodcau at Bayou Bodcau Lake
Critical Stages
171.5' - Action
172' - Flood
192' - Moderate
198' - Major
Latest Observation
Updated: 9:00 PM CST 12/14/25
Status: No Flooding
Stage: 158.58 ft
Flow: 0.0592 kcfs
Forecast
Forecast not available for this location.
| Time | Stage (ft) | Flow (kcfs) |
|---|---|---|
| 9:00 PM 12/14 | 158.58 | 0.0592 |
| 8:00 PM 12/14 | 158.57 | 0.0588 |
| 7:00 PM 12/14 | 158.57 | 0.0588 |
| 6:00 PM 12/14 | 158.57 | 0.0588 |
| 5:00 PM 12/14 | 158.56 | 0.0584 |
| 4:00 PM 12/14 | 158.56 | 0.0584 |
| 3:00 PM 12/14 | 158.56 | 0.0584 |
| 2:00 PM 12/14 | 158.56 | 0.0584 |
| 1:00 PM 12/14 | 158.56 | 0.0584 |
| 12:00 PM 12/14 | 158.55 | 0.058 |
| 11:00 AM 12/14 | 158.56 | 0.0584 |
| 10:00 AM 12/14 | 158.56 | 0.0584 |
| 9:00 AM 12/14 | 158.56 | 0.0584 |
| 8:00 AM 12/14 | 158.56 | 0.0584 |
| 7:00 AM 12/14 | 158.56 | 0.0584 |
| 6:00 AM 12/14 | 158.56 | 0.0584 |
| 5:00 AM 12/14 | 158.56 | 0.0584 |
| 4:00 AM 12/14 | 158.56 | 0.0584 |
| 3:00 AM 12/14 | 158.57 | 0.0588 |
| 2:00 AM 12/14 | 158.57 | 0.0588 |
| 1:00 AM 12/14 | 158.57 | 0.0588 |
| 12:00 AM 12/14 | 158.58 | 0.0592 |
| 11:00 PM 12/13 | 158.58 | 0.0592 |
| 10:00 PM 12/13 | 158.57 | 0.0588 |
| 9:00 PM 12/13 | 158.57 | 0.0588 |
| 8:00 PM 12/13 | 158.57 | 0.0588 |
| 7:00 PM 12/13 | 158.57 | 0.0588 |
| 6:00 PM 12/13 | 158.57 | 0.0588 |
| 5:00 PM 12/13 | 158.57 | 0.0588 |
| 4:00 PM 12/13 | 158.57 | 0.0588 |
195' -
Lowland flooding will be rather severe and widespread. Several secondary roadways will be completely flooded and travel will be difficult by wheeled vehicles.
192' -
Expect rather widespread lowland flooding. Boats should be secured and moved away from the lake. Several secondary roadways will be flooded and closed.
172' -
Expect bankfull conditions on Red Chute Bayou.
170' -
Expect minor lowland flooding along the lake. Red Chute Bayou below the lake will be at bankfull. Some secondary roadways may suffer flooding.
| Date | Stage (ft) |
|---|---|
| Nov 5, 2009 | 200.27 |
| Mar 18, 2001 | 197.4 |
| May 11, 1958 | 196.67 |
| May 11, 1991 | 193.09 |
| Mar 10, 2018 | 192.7 |
| Mar 19, 2016 | 191.93 |
| May 8, 2016 | 190.55 |
| May 20, 2019 | 188.93 |
| Mar 28, 2015 | 188.19 |
| Mar 26, 1953 | 187.01 |
| Apr 17, 1990 | 186.98 |
| May 11, 1966 | 185.65 |
| Mar 11, 2021 | 185.06 |
| Feb 24, 1950 | 184.9 |
| Feb 1, 1974 | 184.88 |
| Jan 12, 2019 | 184.53 |
| May 10, 1957 | 184.44 |
| Jan 26, 1988 | 184.32 |
| May 8, 1973 | 183.4 |
| Dec 28, 2001 | 182.6 |
Data provided by the National Weather Service.