« Back to Veterans Park Rivers
Bayou Dorcheat at Lake Bistineau
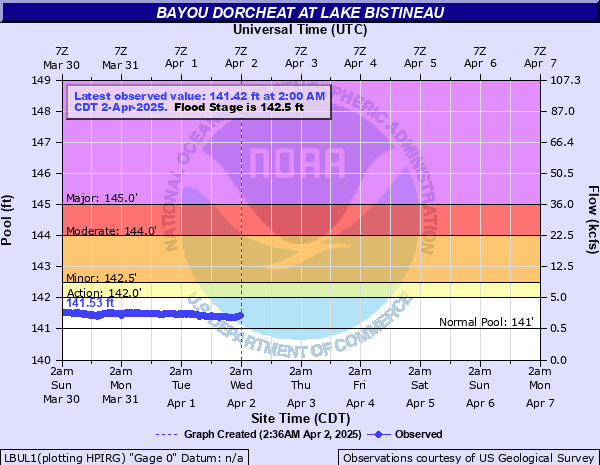
Critical Stages
142' - Action
142.5' - Flood
144' - Moderate
145' - Major
Latest Observation
Updated: 9:00 PM CST 12/14/25
Status: No Flooding
Stage: 135.49 ft
Flow: 0.007 kcfs
Forecast
Forecast not available for this location.
| Time | Stage (ft) | Flow (kcfs) |
|---|---|---|
| 9:00 PM 12/14 | 135.49 | 0.007 |
| 8:30 PM 12/14 | 135.47 | 0.007 |
| 8:00 PM 12/14 | 135.48 | 0.007 |
| 7:30 PM 12/14 | 135.49 | 0.007 |
| 7:00 PM 12/14 | 135.48 | 0.007 |
| 6:30 PM 12/14 | 135.47 | 0.007 |
| 6:00 PM 12/14 | 135.47 | 0.007 |
| 5:30 PM 12/14 | 135.48 | 0.007 |
| 5:00 PM 12/14 | 135.49 | 0.007 |
| 4:30 PM 12/14 | 135.49 | 0.007 |
| 4:00 PM 12/14 | 135.52 | 0.007 |
| 3:30 PM 12/14 | 135.52 | 0.007 |
| 3:00 PM 12/14 | 135.51 | 0.007 |
| 2:30 PM 12/14 | 135.49 | 0.007 |
| 2:00 PM 12/14 | 135.52 | 0.007 |
| 1:30 PM 12/14 | 135.52 | 0.007 |
| 1:00 PM 12/14 | 135.53 | 0.007 |
| 12:30 PM 12/14 | 135.52 | 0.007 |
| 12:00 PM 12/14 | 135.54 | 0.007 |
| 11:30 AM 12/14 | 135.52 | 0.007 |
| 11:00 AM 12/14 | 135.54 | 0.007 |
| 10:30 AM 12/14 | 135.55 | 0.007 |
| 10:00 AM 12/14 | 135.55 | 0.007 |
| 9:30 AM 12/14 | 135.51 | 0.007 |
| 9:00 AM 12/14 | 135.51 | 0.007 |
| 8:30 AM 12/14 | 135.5 | 0.007 |
| 8:00 AM 12/14 | 135.46 | 0.007 |
| 7:30 AM 12/14 | 135.52 | 0.007 |
| 7:00 AM 12/14 | 135.51 | 0.007 |
| 6:30 AM 12/14 | 135.47 | 0.007 |
149' -
Near record flooding of several thousand acres with numerous unstilted homes flooded.
147' -
Several unstilted homes face flooding. All lake roads inundated at this point.
145' -
Preparations for major flooding should be rushed to completion as the lake roads are cut off by high water. A few unstilted cabins may suffer overflow.
144' -
Most camps across the lake begin to flood. Some homes will also face flooding especially homes that are not stilted. Preparations for flooding should be rushed to completion.
143' -
Water begins to flow over Louisiana 164.
142.5' -
Expect some minor flooding of low area camps, however, all access roadways will remain open.
| Date | Stage (ft) |
|---|---|
| Mar 13, 2016 | 150.16 |
| Apr 18, 1991 | 147.79 |
| Nov 4, 2009 | 147.48 |
| Mar 5, 2001 | 147.1 |
| Feb 1, 1999 | 145.48 |
| Jul 4, 1989 | 145.37 |
| Jun 12, 2015 | 145.28 |
| Mar 3, 2018 | 145.07 |
| Mar 6, 2021 | 144.7 |
| Feb 8, 1975 | 144.6 |
| Jun 15, 1974 | 144.6 |
| Feb 8, 1990 | 144.53 |
| Mar 19, 2015 | 144.5 |
| May 8, 1975 | 143.9 |
| Dec 23, 2001 | 143.7 |
| Jan 3, 1988 | 143.7 |
| May 7, 1979 | 143.7 |
| Jan 3, 1983 | 143.5 |
| Mar 25, 2012 | 143.5 |
| Jan 8, 1998 | 142.88 |
Data provided by the National Weather Service.