« Back to Veterans Park Rivers
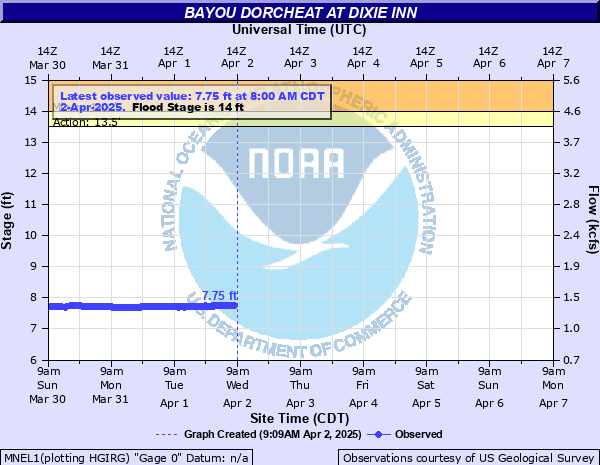
Bayou Dorcheat at Dixie Inn
Critical Stages
13.5' - Action
14' - Flood
20' - Moderate
24' - Major
Latest Observation
Updated: 9:00 PM CST 12/14/25
Status: No Flooding
Stage: 2.42 ft
Flow: 0.239 kcfs
Forecast
Forecast not available for this location.
| Time | Stage (ft) | Flow (kcfs) |
|---|---|---|
| 10:00 PM 12/14 | 2.42 | 0.239 |
| 9:30 PM 12/14 | 2.42 | 0.239 |
| 9:00 PM 12/14 | 2.42 | 0.239 |
| 8:30 PM 12/14 | 2.42 | 0.239 |
| 8:00 PM 12/14 | 2.43 | 0.241 |
| 7:30 PM 12/14 | 2.43 | 0.241 |
| 7:00 PM 12/14 | 2.43 | 0.241 |
| 6:30 PM 12/14 | 2.43 | 0.241 |
| 6:00 PM 12/14 | 2.44 | 0.243 |
| 5:30 PM 12/14 | 2.44 | 0.243 |
| 5:00 PM 12/14 | 2.44 | 0.243 |
| 4:30 PM 12/14 | 2.45 | 0.244 |
| 4:00 PM 12/14 | 2.45 | 0.244 |
| 3:30 PM 12/14 | 2.45 | 0.244 |
| 3:00 PM 12/14 | 2.46 | 0.246 |
| 2:30 PM 12/14 | 2.46 | 0.246 |
| 2:00 PM 12/14 | 2.47 | 0.248 |
| 1:30 PM 12/14 | 2.47 | 0.248 |
| 1:00 PM 12/14 | 2.48 | 0.25 |
| 12:30 PM 12/14 | 2.48 | 0.25 |
| 12:00 PM 12/14 | 2.48 | 0.25 |
| 11:30 AM 12/14 | 2.49 | 0.251 |
| 11:00 AM 12/14 | 2.5 | 0.253 |
| 10:30 AM 12/14 | 2.5 | 0.253 |
| 10:00 AM 12/14 | 2.5 | 0.253 |
| 9:30 AM 12/14 | 2.51 | 0.255 |
| 9:00 AM 12/14 | 2.51 | 0.255 |
| 8:30 AM 12/14 | 2.52 | 0.257 |
| 8:00 AM 12/14 | 2.52 | 0.257 |
| 7:30 AM 12/14 | 2.52 | 0.257 |
24' -
Major flooding of several hundred acres of land. Preparations should be completed for near record flooding. The Bayou Inn in Dixie Inn will face flooding problems also. In addition, the old highway 80 bridge will be inundated as well. Some homes downstream from Dixie Inn and upstream from Lake Bistineau also face flooding. Homeowners in low areas prone to high water on Bayou Dorcheat should rush preparations to completion for flooding.
20' -
Expect moderate to severe flooding of bayou bottoms. The boat ramp park at Dixie Inn is completely flooded at this point.
19' -
Lowland flooding will continue for several more days. The bayou will continue to slowly fall and flood problems will decrease and end.
14' -
Expect minor lowland flooding with the boat ramp suffering overflow.
| Date | Stage (ft) |
|---|---|
| Mar 12, 2016 | 25.95 |
| Apr 8, 1997 | 25.12 |
| May 1, 1958 | 24.9 |
| Nov 2, 2009 | 24.05 |
| Apr 16, 1991 | 23.49 |
| Jun 12, 1974 | 23.31 |
| Oct 18, 2009 | 23.2 |
| May 21, 1930 | 22.95 |
| Mar 12, 1990 | 22.38 |
| Feb 6, 1975 | 22.35 |
| Mar 4, 2021 | 22.3 |
| Mar 4, 2001 | 22.2 |
| Feb 5, 1975 | 22.2 |
| May 2, 1957 | 22.12 |
| Jan 1, 1988 | 21.62 |
| Jul 26, 1933 | 21.12 |
| Jan 31, 1999 | 21.02 |
| Apr 29, 1973 | 20.96 |
| May 5, 1945 | 20.84 |
| May 18, 1953 | 20.78 |
Data provided by the National Weather Service.