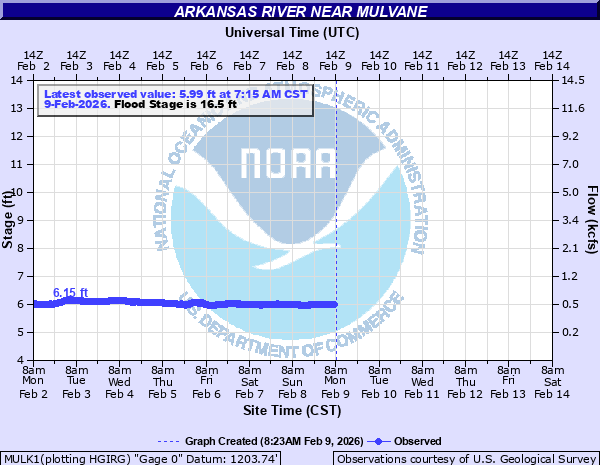
Arkansas River near Mulvane
Critical Stages
15' - Action
16.5' - Flood
19' - Moderate
21' - Major
Latest Observation
Updated: 6:15 AM CST 12/16/25
Status: No Flooding
Stage: 6.1 ft
Flow: 0.523 kcfs
Forecast
Forecast not available for this location.
| Time | Stage (ft) | Flow (kcfs) |
|---|---|---|
| 7:15 AM 12/16 | 6.1 | 0.523 |
| 7:00 AM 12/16 | 6.1 | 0.523 |
| 6:45 AM 12/16 | 6.1 | 0.523 |
| 6:30 AM 12/16 | 6.1 | 0.523 |
| 6:15 AM 12/16 | 6.1 | 0.523 |
| 6:00 AM 12/16 | 6.1 | 0.523 |
| 5:45 AM 12/16 | 6.1 | 0.523 |
| 5:30 AM 12/16 | 6.1 | 0.523 |
| 5:15 AM 12/16 | 6.1 | 0.523 |
| 5:00 AM 12/16 | 6.1 | 0.523 |
| 4:45 AM 12/16 | 6.1 | 0.523 |
| 4:30 AM 12/16 | 6.1 | 0.523 |
| 4:15 AM 12/16 | 6.1 | 0.523 |
| 4:00 AM 12/16 | 6.1 | 0.523 |
| 3:45 AM 12/16 | 6.1 | 0.523 |
| 3:30 AM 12/16 | 6.1 | 0.523 |
| 3:15 AM 12/16 | 6.1 | 0.523 |
| 3:00 AM 12/16 | 6.1 | 0.523 |
| 2:45 AM 12/16 | 6.1 | 0.523 |
| 2:30 AM 12/16 | 6.09 | 0.516 |
| 2:15 AM 12/16 | 6.09 | 0.516 |
| 2:00 AM 12/16 | 6.09 | 0.516 |
| 1:45 AM 12/16 | 6.09 | 0.516 |
| 1:30 AM 12/16 | 6.1 | 0.523 |
| 1:15 AM 12/16 | 6.09 | 0.516 |
| 1:00 AM 12/16 | 6.09 | 0.516 |
| 12:45 AM 12/16 | 6.09 | 0.516 |
| 12:30 AM 12/16 | 6.09 | 0.516 |
| 12:15 AM 12/16 | 6.09 | 0.516 |
| 12:00 AM 12/16 | 6.09 | 0.516 |
21' -
Flood waters may begin to affect residential homes along Estfan Road which is just west near the vicinity of the river gage site.
20.5' -
Flood waters may begin to impact Highway 53, about 1000 ft west of the river bridge gage site.
18.5' -
Flood waters begin to impact the River Vista subdivision at 111th South Street.
16.5' -
Lowland flooding occurs along the vicinity of the river, primarily affecting the farmland northwest of the Highway 53 bridge.
| Date | Stage (ft) |
|---|---|
| Nov 2, 1998 | 20.9 |
| May 25, 2019 | 20.29 |
| Sep 13, 2008 | 19.72 |
| May 9, 2019 | 19.52 |
| Sep 10, 2016 | 19.31 |
| Apr 27, 2009 | 19.1 |
| Jul 3, 2016 | 19.04 |
| Sep 9, 2016 | 18.62 |
| Jun 14, 2010 | 17.85 |
| Aug 9, 2013 | 17.8 |
| Oct 10, 2018 | 17.77 |
| May 28, 2007 | 17.6 |
| Jun 24, 2019 | 17.47 |
| May 9, 2007 | 17.19 |
| Jun 10, 2005 | 16.9 |
| Jun 3, 2025 | 16.7 |
| Mar 5, 2004 | 16.64 |
| Jul 4, 2016 | 16.46 |
| Jun 1, 2022 | 16.32 |
| Jun 16, 2015 | 16.08 |
Data provided by the National Weather Service.