« Back to Volga River State Recreation Area Rivers
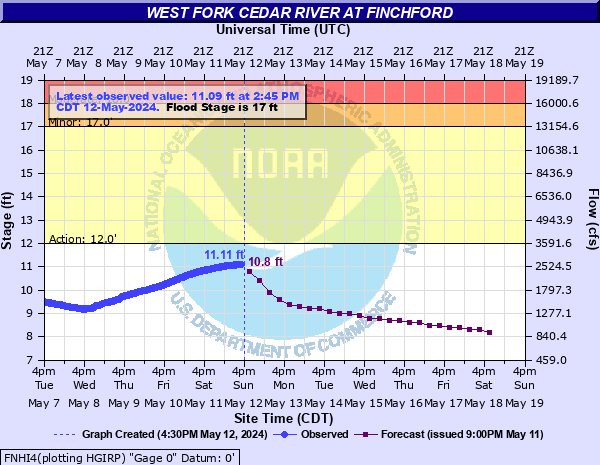
West Fork Cedar River at Finchford
Critical Stages
12' - Action
17' - Flood
18' - Moderate
20' - Major
Latest Observation
Updated: 9:45 PM CST 12/7/25
Status: No Flooding
Stage: 8.45 ft
Flow: 0.902 kcfs
Forecast
Forecast not available for this location.
| Time | Stage (ft) | Flow (kcfs) |
|---|---|---|
| 9:45 PM 12/7 | 8.45 | 0.902 |
| 9:30 PM 12/7 | 8.45 | 0.902 |
| 9:15 PM 12/7 | 8.44 | 0.898 |
| 9:00 PM 12/7 | 8.44 | 0.898 |
| 8:45 PM 12/7 | 8.43 | 0.893 |
| 8:30 PM 12/7 | 8.42 | 0.889 |
| 8:15 PM 12/7 | 8.41 | 0.885 |
| 8:00 PM 12/7 | 8.4 | 0.881 |
| 7:45 PM 12/7 | 8.39 | 0.877 |
| 7:30 PM 12/7 | 8.38 | 0.872 |
| 7:15 PM 12/7 | 8.36 | 0.864 |
| 7:00 PM 12/7 | 8.35 | 0.86 |
| 6:45 PM 12/7 | 8.34 | 0.856 |
| 6:30 PM 12/7 | 8.34 | 0.856 |
| 6:15 PM 12/7 | 8.32 | 0.847 |
| 6:00 PM 12/7 | 8.32 | 0.847 |
| 5:45 PM 12/7 | 8.31 | 0.843 |
| 5:30 PM 12/7 | 8.31 | 0.843 |
| 5:15 PM 12/7 | 8.31 | 0.843 |
| 5:00 PM 12/7 | 8.31 | 0.843 |
| 4:45 PM 12/7 | 8.31 | 0.843 |
| 4:30 PM 12/7 | 8.31 | 0.843 |
| 4:15 PM 12/7 | 8.32 | 0.847 |
| 4:00 PM 12/7 | 8.33 | 0.851 |
| 3:45 PM 12/7 | 8.35 | 0.86 |
| 3:30 PM 12/7 | 8.36 | 0.864 |
| 3:15 PM 12/7 | 8.36 | 0.864 |
| 3:00 PM 12/7 | 8.37 | 0.868 |
| 2:45 PM 12/7 | 8.39 | 0.877 |
| 2:30 PM 12/7 | 8.4 | 0.881 |
18.5' -
Water affects the intersection of Hwy T71 and Hwy C55 at the convenience store. Basement flooding occurs in many residences with some flooding on the main floors. Water is also at the floor level of the convenience store. Water wells may collapse.
17.5' -
Water affects several roads as well as nearby residences and small businesses.
17' -
Water affects Hwy T71 north of the river and threatens the town of Finchford.
16' -
Water affects nearly 20000 acres.
15' -
Water threatens the road fill area along Hwy T71 just north of the river. Water also threatens the bridge 1000 feet north which spans the overflow area.
14' -
Water backs up in nearby basements.
13.5' -
Water affects lowland areas.
12' -
Some lowland flooding occurs.
10.5' -
Water affects low-lying areas.
| Date | Stage (ft) |
|---|---|
| Jun 10, 2008 | 20.82 |
| Jul 29, 1990 | 18.45 |
| Jun 27, 1951 | 17.28 |
| Apr 1, 1993 | 16.73 |
| Sep 26, 2016 | 16.58 |
| Jul 10, 1969 | 16.5 |
| Mar 17, 2019 | 16.14 |
| May 17, 1999 | 16.09 |
| Apr 7, 1965 | 15.91 |
| Sep 23, 2018 | 15.81 |
| Jun 22, 2014 | 15.6 |
| May 20, 1991 | 15.52 |
| Mar 27, 1961 | 15.4 |
| May 25, 2004 | 15.14 |
| May 30, 2013 | 15 |
| Mar 30, 1962 | 14.98 |
| Jun 26, 2010 | 14.97 |
| Jun 23, 1954 | 14.9 |
| Mar 8, 1950 | 14.8 |
| Jul 19, 1968 | 14.51 |
Data provided by the National Weather Service.