« Back to Volga River State Recreation Area Rivers
Turkey River at Garber
Critical Stages
14' - Action
17' - Flood
20' - Moderate
23' - Major
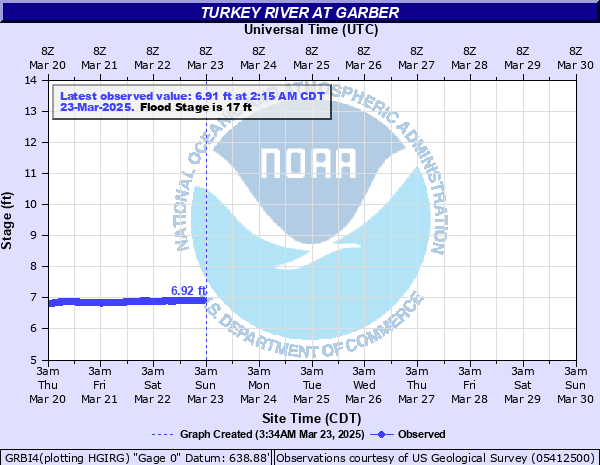
Latest Observation
Updated: 9:15 PM CST 12/7/25
Status: No Flooding
Stage: 6.47 ft
Flow: 0.578 kcfs
Forecast
Forecast not available for this location.
| Time | Stage (ft) | Flow (kcfs) |
|---|---|---|
| 10:15 PM 12/7 | 6.47 | 0.578 |
| 10:00 PM 12/7 | 6.47 | 0.578 |
| 9:45 PM 12/7 | 6.47 | 0.578 |
| 9:30 PM 12/7 | 6.46 | 0.573 |
| 9:15 PM 12/7 | 6.47 | 0.578 |
| 9:00 PM 12/7 | 6.46 | 0.573 |
| 8:45 PM 12/7 | 6.47 | 0.578 |
| 8:30 PM 12/7 | 6.47 | 0.578 |
| 8:15 PM 12/7 | 6.48 | 0.583 |
| 8:00 PM 12/7 | 6.46 | 0.573 |
| 7:45 PM 12/7 | 6.47 | 0.578 |
| 7:30 PM 12/7 | 6.46 | 0.573 |
| 7:15 PM 12/7 | 6.46 | 0.573 |
| 7:00 PM 12/7 | 6.47 | 0.578 |
| 6:45 PM 12/7 | 6.46 | 0.573 |
| 6:30 PM 12/7 | 6.45 | 0.568 |
| 6:15 PM 12/7 | 6.44 | 0.563 |
| 6:00 PM 12/7 | 6.43 | 0.558 |
| 5:45 PM 12/7 | 6.42 | 0.553 |
| 5:30 PM 12/7 | 6.4 | 0.543 |
| 5:15 PM 12/7 | 6.39 | 0.538 |
| 5:00 PM 12/7 | 6.37 | 0.529 |
| 4:45 PM 12/7 | 6.36 | 0.525 |
| 4:30 PM 12/7 | 6.35 | 0.52 |
| 4:15 PM 12/7 | 6.34 | 0.516 |
| 4:00 PM 12/7 | 6.34 | 0.516 |
| 3:45 PM 12/7 | 6.33 | 0.511 |
| 3:30 PM 12/7 | 6.32 | 0.507 |
| 3:15 PM 12/7 | 6.31 | 0.502 |
| 3:00 PM 12/7 | 6.3 | 0.498 |
31.5' -
The earthen levee at Elkport is overtopped.
26' -
The earthen levee at Elkport is threatened, just upstream of Garber.
19' -
County Road X3C at the south end of Garber becomes inundated.
17' -
Minor flooding begins in the communities of Garber, Osterdock, and Millville.
| Date | Stage (ft) |
|---|---|
| May 23, 2004 | 32.8 |
| May 17, 1999 | 30.91 |
| Jun 15, 1991 | 30.1 |
| Jun 10, 2008 | 29.13 |
| Feb 23, 1922 | 28.06 |
| Apr 25, 2008 | 27.98 |
| Jun 22, 2013 | 27.18 |
| Jun 13, 1947 | 26.6 |
| Sep 23, 2016 | 25.6 |
| Mar 15, 2019 | 25.6 |
| Mar 19, 1979 | 25.59 |
| Jul 27, 1940 | 25.3 |
| Feb 9, 1966 | 24.8 |
| Jun 21, 2014 | 24.78 |
| Jun 15, 1925 | 24.7 |
| Mar 29, 1962 | 24.7 |
| Aug 27, 1990 | 24.63 |
| Sep 20, 2018 | 24.47 |
| Jan 5, 1946 | 24.3 |
| Apr 3, 1923 | 24.2 |
Data provided by the National Weather Service.