« Back to Volga River State Recreation Area Rivers
Mississippi River below Lock and Dam 10 - Guttenberg
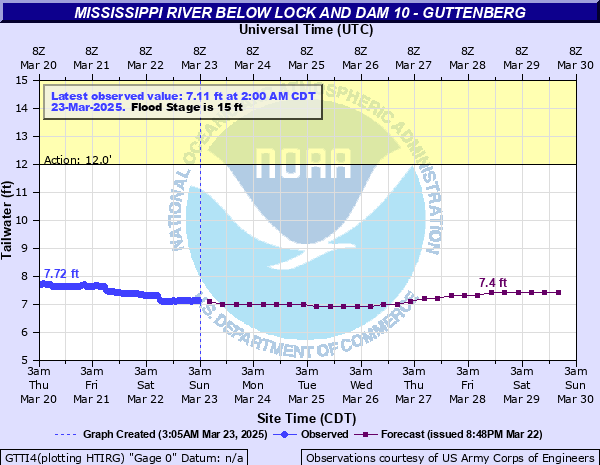
Critical Stages
12' - Action
15' - Flood
18' - Moderate
21' - Major
Latest Observation
Updated: 10:00 PM CST 12/7/25
Status: No Flooding
Stage: 5.06 ft
Flow: 33.3 kcfs
Forecast
Forecast not available for this location.
| Time | Stage (ft) | Flow (kcfs) |
|---|---|---|
| 10:00 PM 12/7 | 5.06 | 33.3 |
| 9:00 PM 12/7 | 5.04 | 33.1 |
| 8:00 PM 12/7 | 5.04 | 33.1 |
| 7:00 PM 12/7 | 5.03 | 33 |
| 6:00 PM 12/7 | 5.02 | 33 |
| 5:00 PM 12/7 | 5.02 | 33 |
| 4:00 PM 12/7 | 5.02 | 33 |
| 3:00 PM 12/7 | 5.02 | 33 |
| 2:00 PM 12/7 | 5.03 | 33 |
| 1:00 PM 12/7 | 5.02 | 33 |
| 12:00 PM 12/7 | 5.02 | 33 |
| 11:00 AM 12/7 | 5 | 32.8 |
| 10:00 AM 12/7 | 4.99 | 32.7 |
| 9:00 AM 12/7 | 4.98 | 32.6 |
| 8:00 AM 12/7 | 4.92 | 31.8 |
| 7:00 AM 12/7 | 4.93 | 31.9 |
| 6:00 AM 12/7 | 4.93 | 31.9 |
| 5:00 AM 12/7 | 4.92 | 31.8 |
| 4:00 AM 12/7 | 4.92 | 31.8 |
| 3:00 AM 12/7 | 4.91 | 31.7 |
| 2:00 AM 12/7 | 4.9 | 31.6 |
| 1:00 AM 12/7 | 4.89 | 31.4 |
| 12:00 AM 12/7 | 4.87 | 31.2 |
| 11:00 PM 12/6 | 4.85 | 31 |
| 10:00 PM 12/6 | 4.84 | 30.8 |
| 9:00 PM 12/6 | 4.82 | 30.6 |
| 8:00 PM 12/6 | 4.8 | 30.4 |
| 7:00 PM 12/6 | 4.8 | 30.4 |
| 6:00 PM 12/6 | 4.8 | 30.4 |
| 5:00 PM 12/6 | 4.78 | 30.1 |
29.6' -
The water begins to overtop the protective levee.
24' -
Water begins to flow over the lock walls and the protective earthen dikes.
23.65' -
Water levels reach the flood of record.
21' -
Flooding of some residential areas occurs. Lock and Dam 10 is closed to navigation.
20' -
Some basements may begin to experience flooding due to seepage, with most problems occurring on the approaches to town.
19' -
The water is over Island Road.
18' -
Sewer and street flooding begins to occur in Glen Haven, Wisconsin.
15.5' -
The water is over Marina Road.
15' -
Minor lowland flooding begins to occur.
| Date | Stage (ft) |
|---|---|
| Apr 24, 1965 | 23.65 |
| Apr 21, 2001 | 21.68 |
| Apr 28, 2023 | 20.98 |
| Jun 30, 1993 | 20.15 |
| Apr 27, 2019 | 19.98 |
| Apr 22, 1969 | 19.84 |
| Apr 24, 1952 | 19.69 |
| Apr 21, 1951 | 19.63 |
| Apr 18, 2011 | 19.58 |
| May 5, 1975 | 19.41 |
| Apr 15, 1997 | 19.4 |
| Jul 6, 2024 | 18.98 |
| Apr 10, 1967 | 18.94 |
| Mar 22, 1973 | 18.59 |
| Oct 5, 1986 | 18.43 |
| Apr 10, 1986 | 18.24 |
| May 29, 1938 | 18.1 |
| May 11, 1954 | 17.8 |
| May 31, 2019 | 17.59 |
| Oct 2, 2010 | 17.48 |
Data provided by the National Weather Service.