« Back to Volga River State Recreation Area Rivers
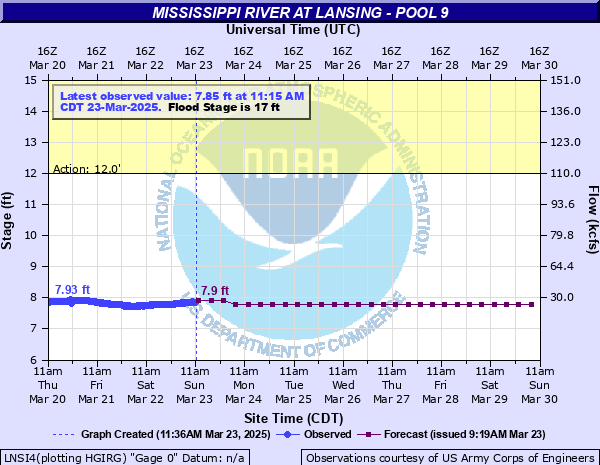
Mississippi River at Lansing - Pool 9
Critical Stages
12' - Action
17' - Flood
19' - Moderate
20' - Major
Latest Observation
Updated: 10:15 PM CST 12/7/25
Status: No Flooding
Stage: 8.21 ft
Flow: 40.3 kcfs
Forecast
Forecast not available for this location.
| Time | Stage (ft) | Flow (kcfs) |
|---|---|---|
| 10:15 PM 12/7 | 8.21 | 40.3 |
| 10:00 PM 12/7 | 8.21 | 40.3 |
| 9:45 PM 12/7 | 8.21 | 40.3 |
| 9:30 PM 12/7 | 8.21 | 40.3 |
| 9:15 PM 12/7 | 8.21 | 40.3 |
| 9:00 PM 12/7 | 8.21 | 40.3 |
| 8:45 PM 12/7 | 8.21 | 40.3 |
| 8:30 PM 12/7 | 8.22 | 40.6 |
| 8:15 PM 12/7 | 8.22 | 40.6 |
| 8:00 PM 12/7 | 8.22 | 40.6 |
| 7:45 PM 12/7 | 8.22 | 40.6 |
| 7:30 PM 12/7 | 8.22 | 40.6 |
| 7:15 PM 12/7 | 8.22 | 40.6 |
| 7:00 PM 12/7 | 8.22 | 40.6 |
| 6:45 PM 12/7 | 8.22 | 40.6 |
| 6:30 PM 12/7 | 8.22 | 40.6 |
| 6:15 PM 12/7 | 8.22 | 40.6 |
| 6:00 PM 12/7 | 8.22 | 40.6 |
| 5:45 PM 12/7 | 8.22 | 40.6 |
| 5:30 PM 12/7 | 8.23 | 40.9 |
| 5:15 PM 12/7 | 8.23 | 40.9 |
| 5:00 PM 12/7 | 8.23 | 40.9 |
| 4:45 PM 12/7 | 8.23 | 40.9 |
| 4:30 PM 12/7 | 8.23 | 40.9 |
| 4:15 PM 12/7 | 8.23 | 40.9 |
| 4:00 PM 12/7 | 8.23 | 40.9 |
| 3:45 PM 12/7 | 8.23 | 40.9 |
| 3:30 PM 12/7 | 8.23 | 40.9 |
| 3:15 PM 12/7 | 8.23 | 40.9 |
| 3:00 PM 12/7 | 8.24 | 41.2 |
24' -
The water reaches the top of the dikes.
23' -
Interstate Power steam plant becomes inoperative.
22.5' -
The water reaches the flood of record set in 1965.
21' -
Dairyland Power becomes inoperative.
20' -
The Wisconsin Highway 82 river crossing between Highway 35 and Lansing is closed.
19.8' -
Water from the storm sewer system covers the 700 block of South Front Street.
18.8' -
Water begins to cover Highway X52 by the wastewater treatment plant.
18.6' -
Water from the storm sewer system covers the 400 block of South Front Street.
18.2' -
Lock and Dam 9 goes out of operation.
17.89' -
Water from the storm sewer system reaches the 300 and 500 blocks of South Front Street.
17.6' -
Water from the storm sewer system covers the 600 block of South Front Street.
14.9' -
River water back flows into Hogan Park by the sewer by-pass.
14.5' -
River water back flows onto the ball park diamond via the lift station bypass.
| Date | Stage (ft) |
|---|---|
| Apr 24, 1965 | 22.5 |
| Apr 21, 2001 | 19.93 |
| Jun 20, 1880 | 19.9 |
| Apr 28, 2023 | 19.61 |
| Apr 22, 1969 | 18.88 |
| Jun 30, 1993 | 18.46 |
| Apr 15, 1997 | 18.38 |
| Apr 23, 1952 | 18.14 |
| Jul 5, 2024 | 18.06 |
| Apr 4, 2019 | 17.89 |
| Apr 26, 2019 | 17.83 |
| May 4, 1975 | 17.76 |
| Apr 20, 1951 | 17.62 |
| Apr 18, 2011 | 17.61 |
| Apr 9, 1967 | 17.18 |
| May 1, 2019 | 17.03 |
| Apr 10, 1986 | 16.8 |
Data provided by the National Weather Service.