« Back to Volga River State Recreation Area Rivers
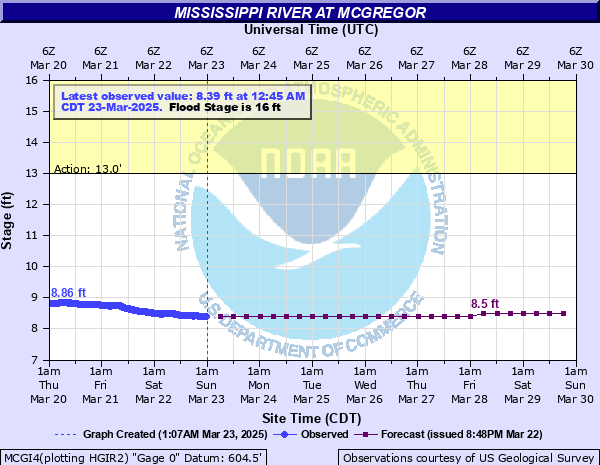
Mississippi River at McGregor
Critical Stages
13' - Action
16' - Flood
19' - Moderate
22' - Major
Latest Observation
Updated: 9:45 PM CST 12/7/25
Status: No Flooding
Stage: 7.58 ft
Flow: -999 kcfs
Forecast
Forecast not available for this location.
| Time | Stage (ft) | Flow (kcfs) |
|---|---|---|
| 9:45 PM 12/7 | 7.58 | -999 |
| 9:30 PM 12/7 | 7.59 | -999 |
| 9:15 PM 12/7 | 7.59 | -999 |
| 9:00 PM 12/7 | 7.59 | -999 |
| 8:45 PM 12/7 | 7.6 | -999 |
| 8:30 PM 12/7 | 7.59 | -999 |
| 8:15 PM 12/7 | 7.6 | -999 |
| 8:00 PM 12/7 | 7.6 | -999 |
| 7:45 PM 12/7 | 7.61 | -999 |
| 7:30 PM 12/7 | 7.61 | -999 |
| 7:15 PM 12/7 | 7.61 | -999 |
| 7:00 PM 12/7 | 7.61 | -999 |
| 6:45 PM 12/7 | 7.62 | -999 |
| 6:30 PM 12/7 | 7.62 | -999 |
| 6:15 PM 12/7 | 7.62 | -999 |
| 6:00 PM 12/7 | 7.62 | -999 |
| 5:45 PM 12/7 | 7.62 | -999 |
| 5:30 PM 12/7 | 7.63 | -999 |
| 5:15 PM 12/7 | 7.63 | -999 |
| 5:00 PM 12/7 | 7.63 | -999 |
| 4:45 PM 12/7 | 7.63 | -999 |
| 4:30 PM 12/7 | 7.64 | -999 |
| 4:15 PM 12/7 | 7.64 | -999 |
| 4:00 PM 12/7 | 7.64 | -999 |
| 3:45 PM 12/7 | 7.64 | -999 |
| 3:30 PM 12/7 | 7.65 | -999 |
| 3:15 PM 12/7 | 7.65 | -999 |
| 3:00 PM 12/7 | 7.65 | -999 |
| 2:45 PM 12/7 | 7.65 | -999 |
| 2:30 PM 12/7 | 7.66 | -999 |
27.9' -
The water overtops the levee.
25.4' -
The water reaches the flood of record set in 1965.
25' -
Major flooding occurs in McGregor.
23.5' -
The road near the casino in Marquette is closed.
22' -
Water covers the north end of Main Street.
21.5' -
Railroad tracks near the casino in Marquette are closed.
19.6' -
The road to the Prairie du Chien waste water treatment facility is flooded.
19' -
Flooding of some residential areas begin.
18' -
Pumping operations begin at the Prairie du Chien waste water treatment facility.
17' -
Minor lowland flooding begins, and access to parks near the river in Prairie du Chien is affected.
16.5' -
Water may begin to go over the road covering part of Highway C near Highway 18.
16' -
The Washington Street Bridge to Saint Feriole Island begins to flood and is closed. Pumping operations are underway.
| Date | Stage (ft) |
|---|---|
| Apr 24, 1965 | 25.38 |
| Apr 20, 2001 | 23.75 |
| Apr 28, 2023 | 22.91 |
| Jun 29, 1993 | 21.98 |
| Apr 26, 2019 | 21.75 |
| Apr 22, 1969 | 21.58 |
| Apr 15, 1997 | 21.38 |
| Apr 18, 2011 | 21.32 |
| May 5, 1975 | 21.12 |
| Jun 22, 1880 | 21 |
| Apr 23, 1952 | 20.89 |
| Apr 22, 1951 | 20.83 |
| Jul 5, 2024 | 20.75 |
| Apr 10, 1967 | 20.71 |
| Oct 1, 1987 | 20.2 |
| Oct 4, 1986 | 20.2 |
| Mar 22, 1973 | 20.15 |
| Apr 10, 1986 | 20.1 |
| Oct 2, 2010 | 19.43 |
| Jun 2, 2019 | 19.09 |
Data provided by the National Weather Service.