« Back to Volga River State Recreation Area Rivers
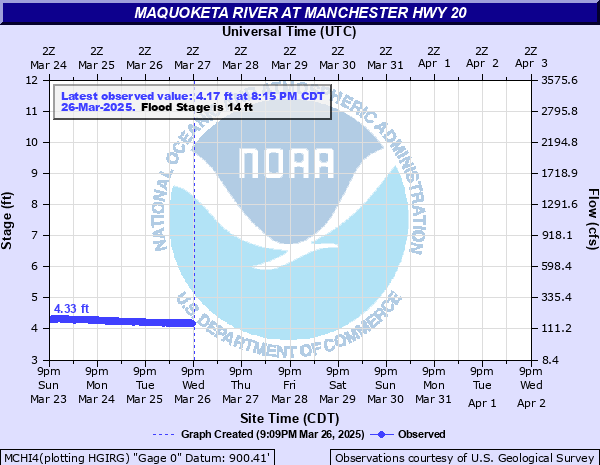
Maquoketa River at Manchester Hwy 20
Critical Stages
12' - Action
14' - Flood
17' - Moderate
20' - Major
Latest Observation
Updated: 10:15 PM CST 12/7/25
Status: No Flooding
Stage: 3.79 ft
Flow: 0.0715 kcfs
Forecast
Forecast not available for this location.
| Time | Stage (ft) | Flow (kcfs) |
|---|---|---|
| 10:15 PM 12/7 | 3.79 | 0.0715 |
| 10:00 PM 12/7 | 3.79 | 0.0715 |
| 9:45 PM 12/7 | 3.8 | 0.073 |
| 9:30 PM 12/7 | 3.79 | 0.0715 |
| 9:15 PM 12/7 | 3.81 | 0.0745 |
| 9:00 PM 12/7 | 3.81 | 0.0745 |
| 8:45 PM 12/7 | 3.82 | 0.076 |
| 8:30 PM 12/7 | 3.82 | 0.076 |
| 8:15 PM 12/7 | 3.83 | 0.0775 |
| 8:00 PM 12/7 | 3.84 | 0.0791 |
| 7:45 PM 12/7 | 3.86 | 0.0823 |
| 7:30 PM 12/7 | 3.86 | 0.0823 |
| 7:15 PM 12/7 | 3.86 | 0.0823 |
| 7:00 PM 12/7 | 3.87 | 0.0839 |
| 6:45 PM 12/7 | 3.87 | 0.0839 |
| 6:30 PM 12/7 | 3.87 | 0.0839 |
| 6:15 PM 12/7 | 3.88 | 0.0856 |
| 6:00 PM 12/7 | 3.87 | 0.0839 |
| 5:45 PM 12/7 | 3.87 | 0.0839 |
| 5:30 PM 12/7 | 3.87 | 0.0839 |
| 5:15 PM 12/7 | 3.87 | 0.0839 |
| 5:00 PM 12/7 | 3.88 | 0.0856 |
| 4:45 PM 12/7 | 3.89 | 0.0873 |
| 4:30 PM 12/7 | 3.88 | 0.0856 |
| 4:15 PM 12/7 | 3.88 | 0.0856 |
| 4:00 PM 12/7 | 3.87 | 0.0839 |
| 3:45 PM 12/7 | 3.88 | 0.0856 |
| 3:30 PM 12/7 | 3.87 | 0.0839 |
| 3:15 PM 12/7 | 3.89 | 0.0873 |
| 3:00 PM 12/7 | 3.89 | 0.0873 |
28' -
Water reaches the bottom of the U.S. Highway 20 bridges.
19' -
Water affects businesses along W Main Street.
17' -
West Main Street and State Highway 13 is closed in Manchester.
16.5' -
Water is on River Street and Main Street in Manchester.
15.7' -
Water is on Schram Drive leading to Schram Park in Manchester.
14' -
Water affects West Main Street. Water also affects residences on the south side of town.
12.5' -
Water affects the campgrounds at lower Bailey's Ford Park.
| Date | Stage (ft) |
|---|---|
| Jul 24, 2010 | 24.48 |
| May 23, 2004 | 21.66 |
| May 26, 2008 | 20.8 |
| Jun 9, 2008 | 20.5 |
| Sep 23, 2016 | 20.34 |
| May 30, 2008 | 20.1 |
| May 30, 2013 | 19.31 |
| Apr 25, 2008 | 18.95 |
| Jun 4, 2002 | 18.35 |
| Mar 15, 2019 | 17.71 |
| Jun 20, 2014 | 16.14 |
| Apr 27, 2009 | 14.37 |
| May 31, 2004 | 14.17 |
| Apr 4, 2007 | 12.18 |
| Jul 9, 2003 | 11.37 |
| Jun 17, 2004 | 10.31 |
| Mar 6, 2004 | 9.68 |
| Mar 23, 2001 | 9.54 |
| Feb 14, 2005 | 9.22 |
| Jul 7, 2004 | 8.99 |
Data provided by the National Weather Service.