« Back to Volga River State Recreation Area Rivers
Shell Rock River at Shell Rock
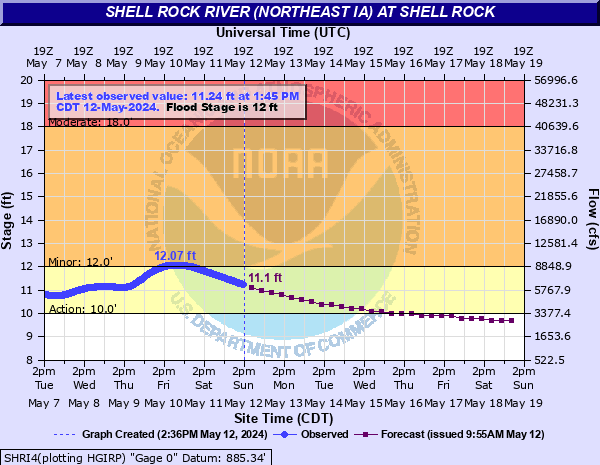
Critical Stages
10' - Action
12' - Flood
18' - Moderate
20' - Major
Latest Observation
Updated: 9:45 PM CST 12/7/25
Status: No Flooding
Stage: 7.83 ft
Flow: 0.394 kcfs
Forecast
Forecast not available for this location.
| Time | Stage (ft) | Flow (kcfs) |
|---|---|---|
| 9:45 PM 12/7 | 7.83 | 0.394 |
| 9:30 PM 12/7 | 7.83 | 0.394 |
| 9:15 PM 12/7 | 7.83 | 0.394 |
| 9:00 PM 12/7 | 7.83 | 0.394 |
| 8:45 PM 12/7 | 7.83 | 0.394 |
| 8:30 PM 12/7 | 7.83 | 0.394 |
| 8:15 PM 12/7 | 7.83 | 0.394 |
| 8:00 PM 12/7 | 7.83 | 0.394 |
| 7:45 PM 12/7 | 7.83 | 0.394 |
| 7:30 PM 12/7 | 7.83 | 0.394 |
| 7:15 PM 12/7 | 7.83 | 0.394 |
| 7:00 PM 12/7 | 7.83 | 0.394 |
| 6:45 PM 12/7 | 7.83 | 0.394 |
| 6:30 PM 12/7 | 7.83 | 0.394 |
| 6:15 PM 12/7 | 7.83 | 0.394 |
| 6:00 PM 12/7 | 7.83 | 0.394 |
| 5:45 PM 12/7 | 7.83 | 0.394 |
| 5:30 PM 12/7 | 7.83 | 0.394 |
| 5:15 PM 12/7 | 7.83 | 0.394 |
| 5:00 PM 12/7 | 7.83 | 0.394 |
| 4:45 PM 12/7 | 7.83 | 0.394 |
| 4:30 PM 12/7 | 7.83 | 0.394 |
| 4:15 PM 12/7 | 7.83 | 0.394 |
| 4:00 PM 12/7 | 7.83 | 0.394 |
| 3:45 PM 12/7 | 7.83 | 0.394 |
| 3:30 PM 12/7 | 7.83 | 0.394 |
| 3:15 PM 12/7 | 7.83 | 0.394 |
| 3:00 PM 12/7 | 7.83 | 0.394 |
| 2:45 PM 12/7 | 7.83 | 0.394 |
| 2:30 PM 12/7 | 7.83 | 0.394 |
21' -
Water affects the approach to the Cherry St bridge.
20' -
Water affects many residences.
18' -
Water nears the top of an arch beneath the Cherry St bridge.
14' -
Flooding occurs in Shell Rock primarily in residential yards.
13.5' -
E Washington St is closed.
13' -
Part of S Lake St is closed.
12.5' -
Seepage occurs in several basements close to the river.
12' -
Water affects S Prairie St.
| Date | Stage (ft) |
|---|---|
| Sep 23, 2016 | 21.4 |
| Jun 10, 2008 | 20.36 |
| Jan 1, 1856 | 17.7 |
| Jul 22, 1999 | 16.73 |
| Mar 28, 1961 | 16.26 |
| May 23, 2004 | 15.87 |
| Jun 30, 1969 | 15.49 |
| Jun 11, 2018 | 15.45 |
| Apr 1, 1993 | 15.21 |
| Apr 7, 1965 | 15.09 |
| Aug 24, 1979 | 15.01 |
| Jun 14, 2013 | 14.95 |
| Mar 16, 2019 | 14.48 |
| May 19, 1991 | 14.36 |
| Apr 13, 2001 | 14.12 |
| Jun 22, 1954 | 14 |
| Jun 21, 2014 | 13.82 |
| Mar 30, 1962 | 13.64 |
| Mar 14, 2010 | 13.64 |
| Jul 29, 1990 | 13.43 |
Data provided by the National Weather Service.