« Back to Wagon Wheel Gap Rivers
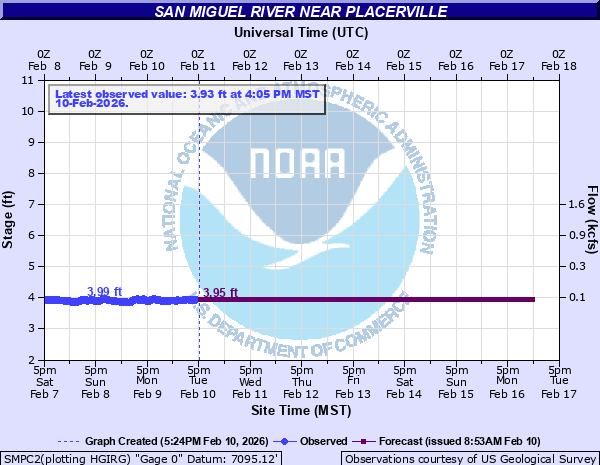
San Miguel River near Placerville
Critical Stages
Action
Flood
Moderate
Major
Latest Observation
Updated: 7:05 AM MST 12/14/25
Status: Not Defined
Stage: 3.9 ft
Flow: 0.0515 kcfs
Forecast
Forecast not available for this location.
| Time | Stage (ft) | Flow (kcfs) |
|---|---|---|
| 8:05 AM 12/14 | 3.88 | 0.0492 |
| 8:00 AM 12/14 | 3.87 | 0.048 |
| 7:55 AM 12/14 | 3.88 | 0.0492 |
| 7:50 AM 12/14 | 3.89 | 0.0503 |
| 7:45 AM 12/14 | 3.88 | 0.0492 |
| 7:40 AM 12/14 | 3.89 | 0.0503 |
| 7:35 AM 12/14 | 3.88 | 0.0492 |
| 7:30 AM 12/14 | 3.89 | 0.0503 |
| 7:25 AM 12/14 | 3.89 | 0.0503 |
| 7:20 AM 12/14 | 3.88 | 0.0492 |
| 7:15 AM 12/14 | 3.9 | 0.0515 |
| 7:10 AM 12/14 | 3.9 | 0.0515 |
| 7:05 AM 12/14 | 3.9 | 0.0515 |
| 7:00 AM 12/14 | 3.9 | 0.0515 |
| 6:55 AM 12/14 | 3.89 | 0.0503 |
| 6:50 AM 12/14 | 3.89 | 0.0503 |
| 6:45 AM 12/14 | 3.9 | 0.0515 |
| 6:40 AM 12/14 | 3.89 | 0.0503 |
| 6:35 AM 12/14 | 3.89 | 0.0503 |
| 6:30 AM 12/14 | 3.9 | 0.0515 |
| 6:25 AM 12/14 | 3.91 | 0.0527 |
| 6:20 AM 12/14 | 3.91 | 0.0527 |
| 6:15 AM 12/14 | 3.91 | 0.0527 |
| 6:10 AM 12/14 | 3.91 | 0.0527 |
| 6:05 AM 12/14 | 3.91 | 0.0527 |
| 6:00 AM 12/14 | 3.93 | 0.0552 |
| 5:55 AM 12/14 | 3.91 | 0.0527 |
| 5:50 AM 12/14 | 3.92 | 0.054 |
| 5:45 AM 12/14 | 3.9 | 0.0515 |
| 5:40 AM 12/14 | 3.91 | 0.0527 |
18.89' -
Water is flowing over the surface of the M44 Bridge.
15.9' -
Water is flowing over the Geyser Road Bridge.
12.6' -
Water has reached the bottom of the M44 Road Bridge.
11.7' -
Water has reached the bottom of the Geyser Road Bridge in Placerville.
8' -
Some residential flooding along the San Miguel River near Placerville is occurring
7' -
Portions of Highway 145 in the vicinity of Placerville are flooded.
6.5' -
Portions of the Placerville Park and Recreation area are flooded.
6' -
Minor low land flooding can be expected adjacent to the river.
5' -
The river has reached bankfull in places.
| Date | Stage (ft) |
|---|---|
| Jun 10, 1985 | 8.06 |
| May 14, 1984 | 7.24 |
| Jun 15, 2019 | 6.94 |
| Jun 21, 2024 | 6.82 |
| Jun 3, 2025 | 6.42 |
| Jun 22, 2023 | 6.39 |
| Jun 28, 1973 | 6.24 |
| Jun 24, 1983 | 6.2 |
| Jun 6, 2020 | 6.06 |
| Apr 23, 1965 | 6.03 |
| May 4, 1970 | 5.98 |
| Oct 11, 2025 | 5.94 |
| May 19, 2022 | 5.91 |
| Jun 5, 2021 | 5.72 |
| Jul 4, 1975 | 5.6 |
| Jul 31, 1999 | 5.59 |
| Jun 6, 1968 | 5.58 |
| Apr 10, 1960 | 5.49 |
| Jun 16, 1979 | 5.38 |
| Jun 17, 1995 | 5.28 |
Data provided by the National Weather Service.