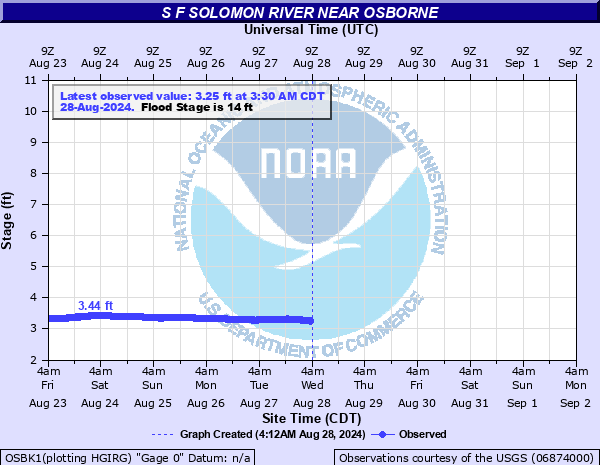
S F Solomon River near Osborne
Critical Stages
12' - Action
14' - Flood
20' - Moderate
27' - Major
Latest Observation
Updated: 1:30 PM CST 12/15/25
Status: No Flooding
Stage: 3.17 ft
Flow: 0.009 kcfs
Forecast
Forecast not available for this location.
| Time | Stage (ft) | Flow (kcfs) |
|---|---|---|
| 1:30 PM 12/15 | 3.17 | 0.009 |
| 1:15 PM 12/15 | 3.17 | 0.009 |
| 1:00 PM 12/15 | 3.17 | 0.009 |
| 12:45 PM 12/15 | 3.17 | 0.009 |
| 12:30 PM 12/15 | 3.17 | 0.009 |
| 12:15 PM 12/15 | 3.17 | 0.009 |
| 12:00 PM 12/15 | 3.17 | 0.009 |
| 11:45 AM 12/15 | 3.17 | 0.009 |
| 11:30 AM 12/15 | 3.17 | 0.009 |
| 11:15 AM 12/15 | 3.17 | 0.009 |
| 11:00 AM 12/15 | 3.17 | 0.009 |
| 10:45 AM 12/15 | 3.17 | 0.009 |
| 10:30 AM 12/15 | 3.17 | 0.009 |
| 10:15 AM 12/15 | 3.17 | 0.009 |
| 10:00 AM 12/15 | 3.17 | 0.009 |
| 9:45 AM 12/15 | 3.17 | 0.009 |
| 9:30 AM 12/15 | 3.16 | 0.0087 |
| 9:15 AM 12/15 | 3.17 | 0.009 |
| 9:00 AM 12/15 | 3.17 | 0.009 |
| 8:45 AM 12/15 | 3.17 | 0.009 |
| 8:30 AM 12/15 | 3.16 | 0.0087 |
| 8:15 AM 12/15 | 3.16 | 0.0087 |
| 8:00 AM 12/15 | 3.17 | 0.009 |
| 7:45 AM 12/15 | 3.17 | 0.009 |
| 7:30 AM 12/15 | 3.16 | 0.0087 |
| 7:15 AM 12/15 | 3.17 | 0.009 |
| 7:00 AM 12/15 | 3.17 | 0.009 |
| 6:45 AM 12/15 | 3.17 | 0.009 |
| 6:30 AM 12/15 | 3.17 | 0.009 |
| 6:15 AM 12/15 | 3.17 | 0.009 |
27' -
Sandbagging of homes north of the river becomes necessary. The record flood occurred in July of 1993 when the river reached 28.33 feet. Water reached the bottom of the bridge on Highway 281, but the city of Osborne was not threatened by flooding. However, most rural county roads that crossed the river were flooded.
20' -
Significant flooding occurs. Many county roads such as 90th...70th...and 55th Avenue will be under water where they cross the river. There will also be significant flooding in and around the Shady Bend Golf Course.
16.5' -
The south approach to 90th Avenue bridge will be threatened by flood water. In addition...the river will flood at the 70th and 55th Avenue Bridges.
14' -
The north approach and bridge on 70th Avenue will begin to flood. In addition...Access to Shady Bend Golf Course via the club house will be cut off.
| Date | Stage (ft) |
|---|---|
| Jul 21, 1993 | 28.33 |
| Jul 13, 1951 | 27.65 |
| Jun 17, 1957 | 22.88 |
| May 22, 1961 | 21.7 |
| Aug 25, 2019 | 21.37 |
| Apr 14, 1987 | 20.98 |
| May 29, 1995 | 20.68 |
| Aug 29, 1950 | 20.13 |
| Jul 2, 1982 | 20.02 |
| Oct 9, 1946 | 20 |
| Jun 2, 2011 | 19.73 |
| Aug 25, 2008 | 19.62 |
| Oct 12, 1973 | 19.27 |
| May 17, 2021 | 18.82 |
| Jun 21, 2010 | 18.76 |
| Nov 17, 1996 | 18.68 |
| Jun 17, 1954 | 18.38 |
| Jul 31, 2020 | 18.22 |
| May 17, 1958 | 18.08 |
| Jun 14, 1949 | 17.85 |
Data provided by the National Weather Service.