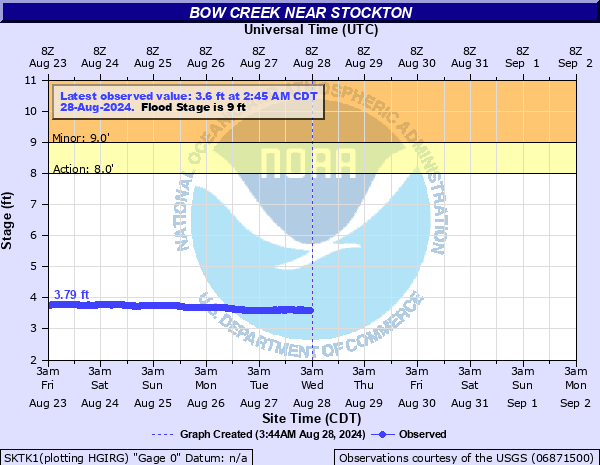
Bow Creek near Stockton
Critical Stages
8' - Action
9' - Flood
12' - Moderate
13.6' - Major
Latest Observation
Updated: 1:45 PM CST 12/15/25
Status: No Flooding
Stage: 4.05 ft
Flow: 0.005 kcfs
Forecast
Forecast not available for this location.
| Time | Stage (ft) | Flow (kcfs) |
|---|---|---|
| 1:45 PM 12/15 | 4.05 | 0.005 |
| 1:30 PM 12/15 | 4.04 | 0.005 |
| 1:15 PM 12/15 | 4.03 | 0.005 |
| 1:00 PM 12/15 | 4.03 | 0.005 |
| 12:45 PM 12/15 | 4.03 | 0.005 |
| 12:30 PM 12/15 | 4.02 | 0.005 |
| 12:15 PM 12/15 | 4.02 | 0.005 |
| 12:00 PM 12/15 | 4.01 | 0.005 |
| 11:45 AM 12/15 | 4.01 | 0.005 |
| 11:30 AM 12/15 | 4 | 0.005 |
| 11:15 AM 12/15 | 3.99 | 0.005 |
| 11:00 AM 12/15 | 3.98 | 0.005 |
| 10:45 AM 12/15 | 3.98 | 0.005 |
| 10:30 AM 12/15 | 3.97 | 0.005 |
| 10:15 AM 12/15 | 3.97 | 0.005 |
| 10:00 AM 12/15 | 3.96 | 0.005 |
| 9:45 AM 12/15 | 3.96 | 0.005 |
| 9:30 AM 12/15 | 3.95 | 0.005 |
| 9:15 AM 12/15 | 3.95 | 0.005 |
| 9:00 AM 12/15 | 3.95 | 0.005 |
| 8:45 AM 12/15 | 3.95 | 0.005 |
| 8:30 AM 12/15 | 3.95 | 0.005 |
| 8:15 AM 12/15 | 3.94 | 0.005 |
| 8:00 AM 12/15 | 3.94 | 0.005 |
| 7:45 AM 12/15 | 3.94 | 0.005 |
| 7:30 AM 12/15 | 3.94 | 0.005 |
| 7:15 AM 12/15 | 3.94 | 0.005 |
| 7:00 AM 12/15 | 3.94 | 0.005 |
| 6:45 AM 12/15 | 3.94 | 0.005 |
| 6:30 AM 12/15 | 3.94 | 0.005 |
14.3' -
A maximum height of 14.3 feet was reached on June 19, 2010.
12' -
Highway 183 and 3 Road will both remain passible, but most county gravel roads that cross the Bow Creek between Highway 183 and 3 Road will be flooded.
9' -
Water overflows both banks of the river and flows into adjacent agricultural lowland. Gravel county roads along and crossing the Bow Creek both upstream and downstream of the Highway 183 gauge site will begin to flood. Several of the roads that will flood include: A Road, B Road, and 17 Road.
| Date | Stage (ft) |
|---|---|
| Jun 19, 2010 | 14.29 |
| Aug 28, 2014 | 13.63 |
| Jul 12, 1951 | 13.6 |
| May 20, 1969 | 13.51 |
| May 27, 1995 | 13.49 |
| May 24, 2008 | 13.31 |
| Jun 15, 1984 | 13.1 |
| Aug 15, 1968 | 12.81 |
| Sep 5, 2016 | 12.65 |
| Jun 15, 2009 | 12.23 |
| Jul 9, 1993 | 11.8 |
| Jul 1, 1982 | 11.78 |
| Jun 20, 1975 | 11.25 |
| Jun 17, 1957 | 10.7 |
| May 29, 2018 | 10.55 |
| Oct 3, 2017 | 10.38 |
| Jun 5, 2022 | 10.21 |
| Jul 25, 2015 | 10.18 |
| Jun 15, 1954 | 10.12 |
| May 28, 2019 | 9.88 |
Data provided by the National Weather Service.