« Back to Warehouse Point Rivers
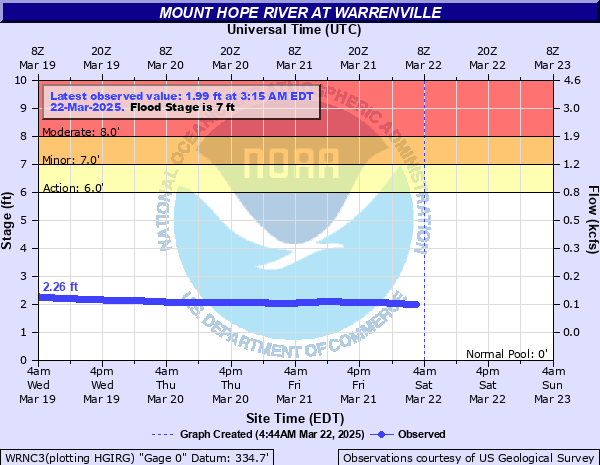
Mount Hope River at Warrenville
Critical Stages
6' - Action
7' - Flood
8' - Moderate
10' - Major
Latest Observation
Updated: 5:15 PM EST 12/15/25
Status: No Flooding
Stage: 1.48 ft
Flow: 0.0219 kcfs
Forecast
Forecast not available for this location.
| Time | Stage (ft) | Flow (kcfs) |
|---|---|---|
| 5:15 PM 12/15 | 1.48 | 0.0219 |
| 5:00 PM 12/15 | 1.49 | 0.0225 |
| 4:45 PM 12/15 | 1.48 | 0.0219 |
| 4:30 PM 12/15 | 1.48 | 0.0219 |
| 4:15 PM 12/15 | 1.48 | 0.0219 |
| 4:00 PM 12/15 | 1.48 | 0.0219 |
| 3:45 PM 12/15 | 1.49 | 0.0225 |
| 3:30 PM 12/15 | 1.49 | 0.0225 |
| 3:15 PM 12/15 | 1.49 | 0.0225 |
| 3:00 PM 12/15 | 1.5 | 0.023 |
| 2:45 PM 12/15 | 1.5 | 0.023 |
| 2:30 PM 12/15 | 1.51 | 0.0236 |
| 2:15 PM 12/15 | 1.51 | 0.0236 |
| 2:00 PM 12/15 | 1.52 | 0.0241 |
| 1:45 PM 12/15 | 1.52 | 0.0241 |
| 1:30 PM 12/15 | 1.53 | 0.0247 |
| 1:15 PM 12/15 | 1.56 | 0.0265 |
| 1:00 PM 12/15 | 1.58 | 0.0277 |
| 12:45 PM 12/15 | 1.6 | 0.029 |
| 12:30 PM 12/15 | 1.61 | 0.0297 |
| 12:15 PM 12/15 | 1.64 | 0.0317 |
| 12:00 PM 12/15 | 1.65 | 0.0324 |
| 11:45 AM 12/15 | 1.65 | 0.0324 |
| 11:30 AM 12/15 | 1.65 | 0.0324 |
| 11:15 AM 12/15 | 1.66 | 0.0331 |
| 11:00 AM 12/15 | 1.67 | 0.0338 |
| 10:45 AM 12/15 | 1.68 | 0.0345 |
| 10:30 AM 12/15 | 1.68 | 0.0345 |
| 10:15 AM 12/15 | 1.69 | 0.0353 |
| 10:00 AM 12/15 | 1.69 | 0.0353 |
8.5' -
Major flooding will occur along the river through Ashford and northern Mansfield. Some homes may experience flooding. A portion of Route 89 may also become impassible north of the Route 89/Route 44 interchange.
7' -
Minor flooding will occur to property immediately along the river in Ashford and the north portion of Mansfield.
| Date | Stage (ft) |
|---|---|
| Sep 21, 1938 | 14.5 |
| Jul 17, 2021 | 10.68 |
| Aug 19, 1955 | 10.41 |
| Oct 15, 2005 | 10.15 |
| Jan 26, 1978 | 9.51 |
| Sep 2, 2021 | 9.22 |
| Sep 11, 1954 | 9.2 |
| Jan 25, 1979 | 9.09 |
| Jul 10, 2021 | 8.89 |
| Apr 16, 1996 | 8.86 |
| Jun 6, 1982 | 8.85 |
| Mar 22, 1980 | 8.54 |
| Aug 13, 1989 | 8.53 |
| Mar 9, 1998 | 8.5 |
| Feb 3, 1970 | 8.47 |
| Mar 7, 2011 | 8.46 |
| Dec 18, 2023 | 8.37 |
| Dec 21, 1973 | 8.12 |
| Jan 10, 2024 | 8.12 |
| Mar 30, 2010 | 7.92 |
Data provided by the National Weather Service.