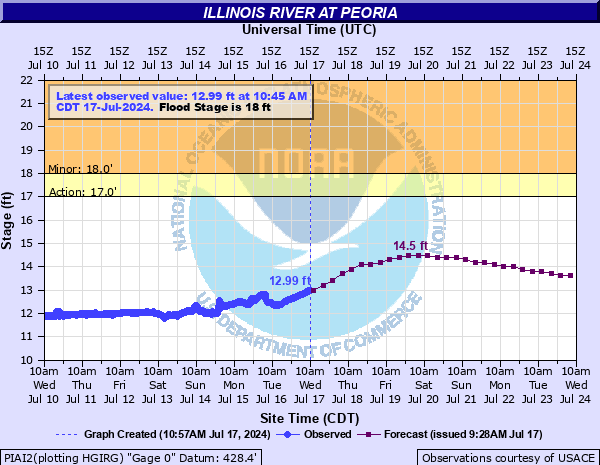
Illinois River at Peoria
Critical Stages
17' - Action
18' - Flood
22' - Moderate
28' - Major
Latest Observation
Updated: 8:45 PM CST 12/14/25
Status: No Flooding
Stage: 11.42 ft
Flow: 4.75 kcfs
Forecast
| Time | Stage (ft) | Flow (kcfs) |
|---|---|---|
| 12 AM 12/15 | 11.4 | 4.74 |
| 6 AM 12/15 | 11.4 | 4.74 |
| 12 PM 12/15 | 11.4 | 4.74 |
| 6 PM 12/15 | 11.4 | 4.74 |
| 12 AM 12/16 | 11.4 | 4.74 |
| 6 AM 12/16 | 11.4 | 4.74 |
| 12 PM 12/16 | 11.4 | 4.74 |
| 6 PM 12/16 | 11.4 | 4.74 |
| 12 AM 12/17 | 11.4 | 4.74 |
| 6 AM 12/17 | 11.4 | 4.74 |
| 12 PM 12/17 | 11.4 | 4.74 |
| 6 PM 12/17 | 11.4 | 4.74 |
| 12 AM 12/18 | 11.4 | 4.74 |
| 6 AM 12/18 | 11.4 | 4.74 |
| 12 PM 12/18 | 11.4 | 4.74 |
| 6 PM 12/18 | 11.4 | 4.74 |
| 12 AM 12/19 | 11.5 | 4.77 |
| 6 AM 12/19 | 11.5 | 4.77 |
| 12 PM 12/19 | 11.6 | 4.8 |
| 6 PM 12/19 | 11.6 | 4.8 |
| 12 AM 12/20 | 11.7 | 4.9 |
| 6 AM 12/20 | 11.7 | 4.9 |
| 12 PM 12/20 | 11.8 | 5 |
| 6 PM 12/20 | 11.8 | 5 |
| 12 AM 12/21 | 11.8 | 5 |
| 6 AM 12/21 | 11.7 | 4.9 |
| 12 PM 12/21 | 11.7 | 4.9 |
| 6 PM 12/21 | 11.6 | 4.8 |
| Time | Stage (ft) | Flow (kcfs) |
|---|---|---|
| 8:45 PM 12/14 | 11.42 | 4.75 |
| 8:30 PM 12/14 | 11.35 | 4.73 |
| 8:15 PM 12/14 | 11.37 | 4.73 |
| 8:00 PM 12/14 | 11.37 | 4.73 |
| 7:45 PM 12/14 | 11.35 | 4.73 |
| 7:30 PM 12/14 | 11.35 | 4.73 |
| 7:15 PM 12/14 | 11.35 | 4.73 |
| 7:00 PM 12/14 | 11.35 | 4.73 |
| 6:45 PM 12/14 | 11.35 | 4.73 |
| 6:30 PM 12/14 | 11.34 | 4.72 |
| 6:15 PM 12/14 | 11.32 | 4.72 |
| 6:00 PM 12/14 | 11.39 | 4.74 |
| 5:45 PM 12/14 | 11.35 | 4.73 |
| 5:30 PM 12/14 | 11.39 | 4.74 |
| 5:15 PM 12/14 | 11.36 | 4.73 |
| 5:00 PM 12/14 | 11.3 | 4.71 |
| 4:45 PM 12/14 | 11.34 | 4.72 |
| 4:30 PM 12/14 | 11.33 | 4.72 |
| 4:15 PM 12/14 | 11.33 | 4.72 |
| 4:00 PM 12/14 | 11.33 | 4.72 |
| 3:45 PM 12/14 | 11.33 | 4.72 |
| 3:30 PM 12/14 | 11.34 | 4.72 |
| 3:15 PM 12/14 | 11.33 | 4.72 |
| 3:00 PM 12/14 | 11.33 | 4.72 |
| 2:45 PM 12/14 | 11.33 | 4.72 |
| 2:30 PM 12/14 | 11.35 | 4.73 |
| 2:15 PM 12/14 | 11.34 | 4.72 |
| 2:00 PM 12/14 | 11.35 | 4.73 |
| 1:45 PM 12/14 | 11.35 | 4.73 |
| 1:30 PM 12/14 | 11.34 | 4.72 |
35.2' -
Komatsu levee overtops.
30.6' -
The Peoria Sanitary District Levee overtopped at 30.6 feet.
30' -
Water overtops the levee at the Pekin sewage treatment plant.
29' -
Water overtops Pekin and LaMarsh levee at the railroad crossing. Constitution Avenue becomes inundated.
28.7' -
Four blocks of Water Street in Peoria are inundated.
28.5' -
Water reaches the lowest door sill elevations in the 300 block of SW Water Street in Peoria.
28' -
Entire Length of Lake Street in Spring Bay is inundated. Water crosses Sunset Drive near Spring Beach Road.
27.5' -
Water begins to flood the 100 block of NE Water Street in Peoria.
27' -
Water begins to flood the 300 block of SW Water Street in Peoria. Water begins to impact homes on Millpoint Road and Sunset Drive in the Spring Bay Township.
26.5' -
Several houses in Rome and Chillicothe become isolated. Homes on Sunset Drive between North Avenue and Collins Avenue...4 miles SSW of Bay View Gardens...are surrounded by water. In Spring Bay...North Lake Street from Missouri Street to Zimmerman Road is flooded.
26.4' -
Water reaches the lowest door sill elevation of Peoria's historic River Station building on Water Street.
26' -
Water inundates road by the railroad track north of the Pekin treatment plant. Liberty Park in Peoria is flooded.
25.6' -
Water crosses South Darst Street in Peoria.
25.1' -
A portion of Layne Crossing and North Street are closed in the Rome and Chillicothe areas. Poplar Lane floods in Peoria Heights.
25' -
Damage begins at Pekin sewage treatment plant. Minor property damage in Peoria by the river.
24.5' -
A portion of River Beach Drive and Second Street become flooded in the Chillicothe and Rome areas.
24' -
Water begins to cover some streets in East Peoria.
23' -
Some secondary roads affected in Peoria county and damage begins to buildings in Rome.
22.7' -
Flooding begins to low lying areas in Peoria Heights and Peoria's Riverfront Park.
18' -
Some flooding begins to bottomland not protected by levees.
17.5' -
Water approaches Spring Bay Park.
16.7' -
Pumping begins in East Peoria near the train yard and Wesley Slough.
| Date | Stage (ft) |
|---|---|
| Apr 23, 2013 | 29.35 |
| May 23, 1943 | 28.8 |
| Mar 23, 1979 | 28.7 |
| Mar 7, 1985 | 28.4 |
| May 7, 2019 | 28 |
| Mar 14, 2009 | 27.94 |
| May 22, 2020 | 27.91 |
| Dec 9, 1982 | 27.4 |
| Mar 23, 1982 | 27.1 |
| Jun 30, 2015 | 27.09 |
| Sep 20, 2008 | 27.06 |
| Jun 2, 2019 | 26.87 |
| Mar 3, 1997 | 26.86 |
| Jan 3, 2016 | 26.49 |
| May 19, 1970 | 25.9 |
| May 30, 1995 | 25.9 |
| Apr 17, 1983 | 25.7 |
| May 18, 1933 | 25.6 |
| May 19, 2009 | 25.49 |
| Feb 27, 2018 | 25.37 |
Data provided by the National Weather Service.