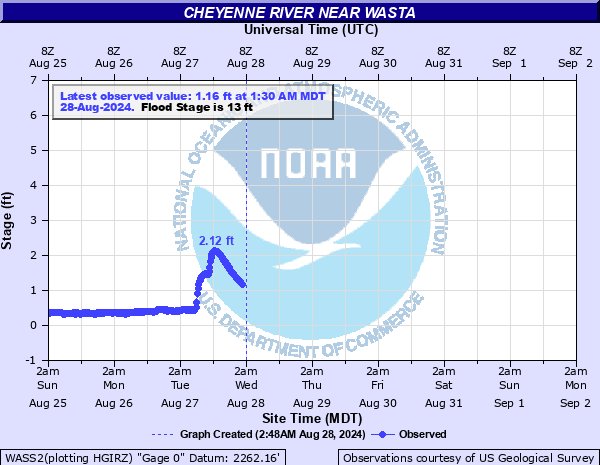
Cheyenne River near Wasta
Critical Stages
11' - Action
13' - Flood
15' - Moderate
16' - Major
Latest Observation
Updated: 2:30 PM MST 12/16/25
Status: No Flooding
Stage: 1.07 ft
Flow: 0.331 kcfs
Forecast
Forecast not available for this location.
| Time | Stage (ft) | Flow (kcfs) |
|---|---|---|
| 2:30 PM 12/16 | 1.07 | 0.331 |
| 2:15 PM 12/16 | 1.08 | 0.338 |
| 2:00 PM 12/16 | 1.08 | 0.338 |
| 1:45 PM 12/16 | 1.1 | 0.351 |
| 1:30 PM 12/16 | 1.1 | 0.351 |
| 1:15 PM 12/16 | 1.11 | 0.357 |
| 1:00 PM 12/16 | 1.12 | 0.363 |
| 12:45 PM 12/16 | 1.13 | 0.37 |
| 12:30 PM 12/16 | 1.14 | 0.376 |
| 12:15 PM 12/16 | 1.15 | 0.382 |
| 12:00 PM 12/16 | 1.14 | 0.376 |
| 11:45 AM 12/16 | 1.13 | 0.37 |
| 10:30 AM 12/16 | 1.1 | 0.351 |
| 10:15 AM 12/16 | 1.1 | 0.351 |
| 10:00 AM 12/16 | 1.1 | 0.351 |
| 9:45 AM 12/16 | 1.1 | 0.351 |
| 9:30 AM 12/16 | 1.1 | 0.351 |
| 9:15 AM 12/16 | 1.1 | 0.351 |
| 9:00 AM 12/16 | 1.09 | 0.344 |
| 8:45 AM 12/16 | 1.09 | 0.344 |
| 8:30 AM 12/16 | 1.09 | 0.344 |
| 8:15 AM 12/16 | 1.09 | 0.344 |
| 8:00 AM 12/16 | 1.09 | 0.344 |
| 7:45 AM 12/16 | 1.08 | 0.338 |
| 7:30 AM 12/16 | 1.08 | 0.338 |
| 7:15 AM 12/16 | 1.08 | 0.338 |
| 7:00 AM 12/16 | 1.08 | 0.338 |
| 6:45 AM 12/16 | 1.08 | 0.338 |
| 6:30 AM 12/16 | 1.08 | 0.338 |
| 6:15 AM 12/16 | 1.08 | 0.338 |
18' -
Near record flooding.
17' -
Extensive flooding along the Cheyenne River with inundation of structures and roads.
16' -
Flooding of agricultural land around Wasta. Some inundation of structures and roads are possible.
15.3' -
Water reaches the lower portion of the Jensen Road Bridge.
14' -
Water may cover the parking lot of the westbound I-90 rest area. Widespread flooding of agricultural land.
13.5' -
Water may begin to affect the railbed of the nearby railroad bridge.
13' -
Water may begin to cause flooding around the I-90 westbound rest area. Water may approach the picnic and parking areas.
11' -
The lowest areas along the river begin to flood.
10' -
Water reaches the lower deck of the railroad bridge.
| Date | Stage (ft) |
|---|---|
| May 15, 1920 | 18 |
| Mar 5, 1982 | 16.25 |
| Jun 13, 1915 | 14.5 |
| May 16, 2015 | 14.03 |
| Mar 18, 2019 | 13.97 |
| May 6, 1932 | 13.28 |
| May 27, 1996 | 12.85 |
| May 12, 1942 | 12.8 |
| May 25, 1965 | 12.78 |
| Aug 2, 2019 | 12.76 |
| Jun 17, 1962 | 12.61 |
| Jun 1, 1935 | 12.6 |
| May 25, 1957 | 12.42 |
| Jul 2, 1982 | 12.35 |
| Jun 22, 1947 | 12.25 |
| Jun 16, 1967 | 12.2 |
| May 22, 1978 | 12.12 |
| May 15, 1965 | 11.98 |
| May 28, 1991 | 11.89 |
| Jun 18, 1964 | 11.65 |
Data provided by the National Weather Service.