« Back to Waukon Junction Rivers
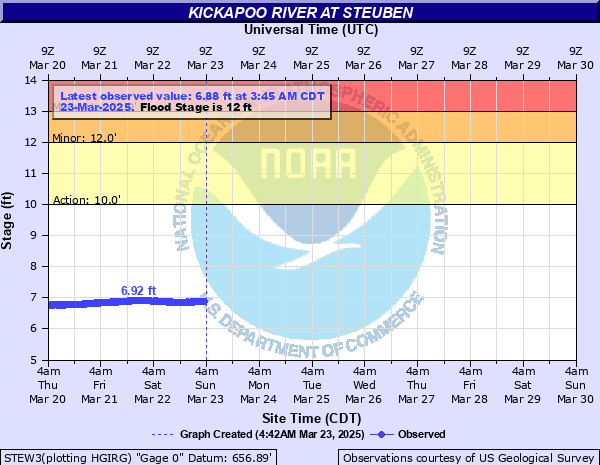
Kickapoo River at Steuben
Critical Stages
10' - Action
12' - Flood
13' - Moderate
15' - Major
Latest Observation
Updated: 11:45 AM CST 12/16/25
Status: No Flooding
Stage: 8.33 ft
Flow: 0.898 kcfs
Forecast
Forecast not available for this location.
| Time | Stage (ft) | Flow (kcfs) |
|---|---|---|
| 11:45 AM 12/16 | 8.33 | 0.898 |
| 11:30 AM 12/16 | 8.32 | 0.896 |
| 11:15 AM 12/16 | 8.33 | 0.898 |
| 11:00 AM 12/16 | 8.32 | 0.896 |
| 10:45 AM 12/16 | 8.32 | 0.896 |
| 10:30 AM 12/16 | 8.32 | 0.896 |
| 10:15 AM 12/16 | 8.32 | 0.896 |
| 10:00 AM 12/16 | 8.32 | 0.896 |
| 9:45 AM 12/16 | 8.33 | 0.898 |
| 9:30 AM 12/16 | 8.34 | 0.901 |
| 9:15 AM 12/16 | 8.34 | 0.901 |
| 9:00 AM 12/16 | 8.34 | 0.901 |
| 8:45 AM 12/16 | 8.34 | 0.901 |
| 8:30 AM 12/16 | 8.35 | 0.904 |
| 8:15 AM 12/16 | 8.36 | 0.907 |
| 8:00 AM 12/16 | 8.37 | 0.91 |
| 7:45 AM 12/16 | 8.37 | 0.91 |
| 7:30 AM 12/16 | 8.38 | 0.912 |
| 7:15 AM 12/16 | 8.38 | 0.912 |
| 7:00 AM 12/16 | 8.38 | 0.912 |
| 6:45 AM 12/16 | 8.39 | 0.915 |
| 6:30 AM 12/16 | 8.39 | 0.915 |
| 6:15 AM 12/16 | 8.4 | 0.918 |
| 6:00 AM 12/16 | 8.4 | 0.918 |
| 5:45 AM 12/16 | 8.42 | 0.924 |
| 5:30 AM 12/16 | 8.41 | 0.921 |
| 5:15 AM 12/16 | 8.42 | 0.924 |
| 5:00 AM 12/16 | 8.41 | 0.921 |
| 4:45 AM 12/16 | 8.43 | 0.927 |
| 4:30 AM 12/16 | 8.42 | 0.924 |
18' -
Water is several feet deep in buildings located along Highway 179.
15' -
The town of Steuben experiences significant flooding.
13' -
Bridge Street near the gage begins to flood and Highway 179 may be threatened.
12.5' -
Water reaches the bottom support beams of the bridge.
12' -
Water starts to affect business and residences and minor flooding affects lowlands and lower roads.
| Date | Stage (ft) |
|---|---|
| Aug 30, 2018 | 19.84 |
| Jun 10, 2008 | 19.16 |
| Jul 3, 1978 | 18 |
| Aug 20, 2007 | 16.84 |
| Sep 24, 2016 | 16.14 |
| Jul 22, 2017 | 15.98 |
| Sep 18, 1992 | 14.38 |
| Jun 24, 2013 | 14.13 |
| Jun 2, 2000 | 13.99 |
| Jul 22, 1951 | 13.66 |
| Aug 17, 2010 | 13.4 |
| Jun 21, 1996 | 13.33 |
| May 5, 1993 | 12.96 |
| Feb 25, 1985 | 12.85 |
| Jun 20, 1984 | 12.85 |
| Feb 10, 1966 | 12.82 |
| May 26, 2004 | 12.8 |
| Jun 27, 2021 | 12.73 |
| Aug 25, 2016 | 12.65 |
| Sep 14, 2019 | 12.63 |
Data provided by the National Weather Service.