Mississippi River below Lock and Dam 7 - La Crescent
Critical Stages
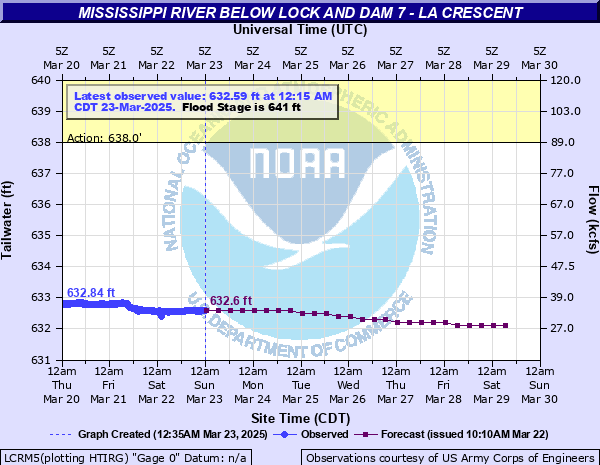
638' - Action
641' - Flood
643' - Moderate
645' - Major
Latest Observation
Updated: 12:15 AM CST 12/15/25
Status: No Flooding
Stage: 631.5 ft
Flow: 18.4 kcfs
Forecast
Forecast not available for this location.
| Time | Stage (ft) | Flow (kcfs) |
|---|---|---|
| 12:15 AM 12/15 | 631.5 | 18.4 |
| 12:00 AM 12/15 | 631.5 | 18.4 |
| 11:45 PM 12/14 | 631.51 | 18.6 |
| 11:30 PM 12/14 | 631.49 | 18.3 |
| 11:15 PM 12/14 | 631.5 | 18.4 |
| 11:00 PM 12/14 | 631.49 | 18.3 |
| 10:45 PM 12/14 | 631.5 | 18.4 |
| 10:30 PM 12/14 | 631.49 | 18.3 |
| 10:15 PM 12/14 | 631.5 | 18.4 |
| 10:00 PM 12/14 | 631.49 | 18.3 |
| 9:45 PM 12/14 | 631.5 | 18.4 |
| 9:30 PM 12/14 | 631.49 | 18.3 |
| 9:15 PM 12/14 | 631.49 | 18.3 |
| 9:00 PM 12/14 | 631.49 | 18.3 |
| 8:45 PM 12/14 | 631.49 | 18.3 |
| 8:30 PM 12/14 | 631.49 | 18.3 |
| 8:15 PM 12/14 | 631.49 | 18.3 |
| 8:00 PM 12/14 | 631.48 | 18.1 |
| 7:45 PM 12/14 | 631.48 | 18.1 |
| 7:30 PM 12/14 | 631.49 | 18.3 |
| 7:15 PM 12/14 | 631.49 | 18.3 |
| 7:00 PM 12/14 | 631.48 | 18.1 |
| 6:45 PM 12/14 | 631.48 | 18.1 |
| 6:30 PM 12/14 | 631.48 | 18.1 |
| 6:15 PM 12/14 | 631.48 | 18.1 |
| 6:00 PM 12/14 | 631.49 | 18.3 |
| 5:45 PM 12/14 | 631.49 | 18.3 |
| 5:30 PM 12/14 | 631.48 | 18.1 |
| 5:15 PM 12/14 | 631.48 | 18.1 |
| 5:00 PM 12/14 | 631.49 | 18.3 |
649' -
Water begins to flow over the protective earthen levees.
647.48' -
Water levels reach the flood of record.
647' -
Water begins to flow over the lock gates and walls.
646.5' -
Lock and dam 7 goes out of operation.
| Date | Stage (ft) |
|---|---|
| Apr 21, 1965 | 647.38 |
| Apr 18, 2001 | 645.2 |
| Apr 20, 1969 | 644.87 |
| Apr 26, 2023 | 644.77 |
| Apr 20, 1952 | 644.3 |
| Apr 19, 1951 | 643.85 |
| Apr 13, 1997 | 643.76 |
| Apr 7, 1967 | 643.55 |
| May 1, 1975 | 643.45 |
| Jun 26, 1993 | 643.23 |
| May 7, 1954 | 643.04 |
| Apr 23, 2019 | 643 |
| Jul 2, 2024 | 642.93 |
| Apr 14, 2011 | 642.88 |
| Apr 8, 1986 | 642.68 |
| Jul 1, 2014 | 642.07 |
| Jun 22, 1943 | 642.05 |
| Sep 27, 2010 | 641.92 |
| Mar 20, 1973 | 641.73 |
| Jun 5, 1942 | 641.65 |
Data provided by the National Weather Service.