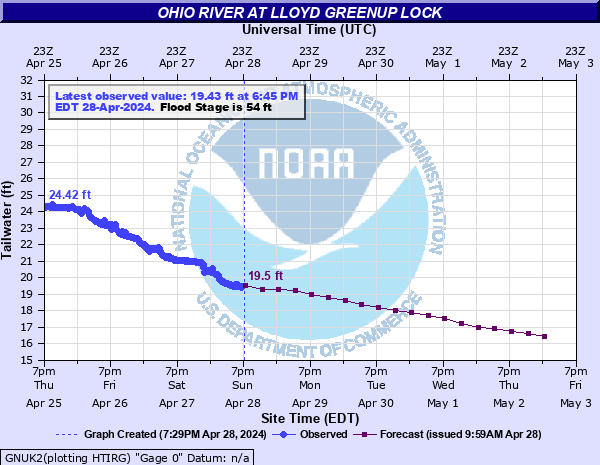
Ohio River at Lloyd Greenup Lock
Critical Stages
52' - Action
54' - Flood
56' - Moderate
62' - Major
Latest Observation
Updated: 11:45 PM EST 12/4/25
Status: No Flooding
Stage: 14.88 ft
Flow: -999 kcfs
Forecast
| Time | Stage (ft) | Flow (kcfs) |
|---|---|---|
| 1 AM 12/5 | 15.8 | -999 |
| 7 AM 12/5 | 15.5 | -999 |
| 1 PM 12/5 | 15.3 | -999 |
| 7 PM 12/5 | 15.1 | -999 |
| 1 AM 12/6 | 15 | -999 |
| 7 AM 12/6 | 14.9 | -999 |
| 1 PM 12/6 | 14.8 | -999 |
| 7 PM 12/6 | 14.7 | -999 |
| 1 AM 12/7 | 14.6 | -999 |
| 7 AM 12/7 | 14.6 | -999 |
| 1 PM 12/7 | 14.5 | -999 |
| 7 PM 12/7 | 14.5 | -999 |
| 1 AM 12/8 | 14.5 | -999 |
| 7 AM 12/8 | 14.5 | -999 |
| 1 PM 12/8 | 14.5 | -999 |
| 7 PM 12/8 | 14.4 | -999 |
| 1 AM 12/9 | 14.4 | -999 |
| 7 AM 12/9 | 14.3 | -999 |
| Time | Stage (ft) | Flow (kcfs) |
|---|---|---|
| 11:45 PM 12/4 | 14.88 | -999 |
| 11:30 PM 12/4 | 14.89 | -999 |
| 11:15 PM 12/4 | 14.92 | -999 |
| 11:00 PM 12/4 | 14.94 | -999 |
| 10:45 PM 12/4 | 14.96 | -999 |
| 10:30 PM 12/4 | 14.98 | -999 |
| 10:15 PM 12/4 | 15.05 | -999 |
| 10:00 PM 12/4 | 15.22 | -999 |
| 9:45 PM 12/4 | 14.98 | -999 |
| 9:30 PM 12/4 | 15.18 | -999 |
| 9:15 PM 12/4 | 15.22 | -999 |
| 9:00 PM 12/4 | 15.21 | -999 |
| 8:45 PM 12/4 | 15.27 | -999 |
| 8:30 PM 12/4 | 15.31 | -999 |
| 8:15 PM 12/4 | 15.31 | -999 |
| 8:00 PM 12/4 | 15.32 | -999 |
| 7:45 PM 12/4 | 15.43 | -999 |
| 7:30 PM 12/4 | 15.42 | -999 |
| 7:15 PM 12/4 | 15.5 | -999 |
| 7:00 PM 12/4 | 15.53 | -999 |
| 6:45 PM 12/4 | 15.58 | -999 |
| 6:30 PM 12/4 | 15.64 | -999 |
| 6:15 PM 12/4 | 15.68 | -999 |
| 6:00 PM 12/4 | 15.78 | -999 |
| 5:45 PM 12/4 | 16.06 | -999 |
| 5:30 PM 12/4 | 16.1 | -999 |
| 5:15 PM 12/4 | 16.11 | -999 |
| 5:00 PM 12/4 | 16.19 | -999 |
| 4:45 PM 12/4 | 16.24 | -999 |
| 4:30 PM 12/4 | 16.34 | -999 |
74.7' -
This flood will exceed the highest stage on record. Large amounts of property damage is expected. Evacuation of homes and businesses will be required.
69' -
Highest ground in Greenup is flooded. Route 23 is closed.
68' -
Water enters 900f residental area of Greenup. CSX Railroad is closed in all parts of Greenup.
67' -
Berry Street in Greenup is flooded.
66' -
Womeck Cemetery is flooded.
65' -
Backwater flooding into Raccoon Creek begins.
64' -
CSX Railroad is closed on east side of Greenup.
62' -
Water enters Greenup High School.
56' -
Several low lying areas flooded and backwater affected on both sides of the river.
54' -
This will cause minor flooding of mainly low-lying areas. Backwater flooding starts on both sides of the river.
| Date | Stage (ft) |
|---|---|
| Jan 27, 1937 | 74.7 |
| Mar 31, 1913 | 64.5 |
| Feb 12, 1884 | 64 |
| Mar 4, 1997 | 62.3 |
| Mar 9, 1945 | 61.7 |
| Dec 11, 1978 | 59.2 |
| Feb 28, 1979 | 59.19 |
| Mar 3, 2021 | 57.99 |
| Feb 20, 2018 | 57.14 |
| Mar 13, 2011 | 56.8 |
| Mar 13, 2011 | 56.8 |
| Jan 10, 2005 | 56.64 |
| Jan 9, 2005 | 56.4 |
| Jan 2, 1991 | 56.04 |
| Feb 18, 2025 | 55.58 |
| Jan 22, 1996 | 55.3 |
| Jan 13, 1974 | 55 |
| Feb 15, 2020 | 54.94 |
| Mar 7, 2015 | 54.8 |
| Mar 14, 2015 | 54.72 |
Data provided by the National Weather Service.