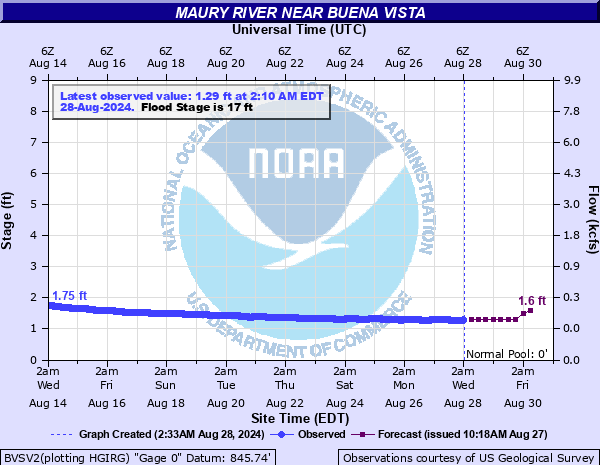
Maury River near Buena Vista
Critical Stages
13' - Action
17' - Flood
19' - Moderate
21' - Major
Latest Observation
Updated: 8:25 PM EST 12/15/25
Status: No Flooding
Stage: 1.39 ft
Flow: 0.0955 kcfs
Forecast
| Time | Stage (ft) | Flow (kcfs) |
|---|---|---|
| 1 AM 12/16 | 1.5 | 0.123 |
| 7 AM 12/16 | 1.5 | 0.123 |
| 1 PM 12/16 | 1.5 | 0.123 |
| 7 PM 12/16 | 1.5 | 0.123 |
| 1 AM 12/17 | 1.5 | 0.123 |
| 7 AM 12/17 | 1.5 | 0.123 |
| 1 PM 12/17 | 1.5 | 0.123 |
| 7 PM 12/17 | 1.5 | 0.123 |
| 1 AM 12/18 | 1.5 | 0.123 |
| 7 AM 12/18 | 1.5 | 0.123 |
| Time | Stage (ft) | Flow (kcfs) |
|---|---|---|
| 8:40 PM 12/15 | 1.39 | 0.0955 |
| 8:35 PM 12/15 | 1.39 | 0.0955 |
| 8:30 PM 12/15 | 1.39 | 0.0955 |
| 8:25 PM 12/15 | 1.39 | 0.0955 |
| 8:20 PM 12/15 | 1.39 | 0.0955 |
| 8:15 PM 12/15 | 1.39 | 0.0955 |
| 8:10 PM 12/15 | 1.39 | 0.0955 |
| 8:05 PM 12/15 | 1.39 | 0.0955 |
| 8:00 PM 12/15 | 1.39 | 0.0955 |
| 7:55 PM 12/15 | 1.39 | 0.0955 |
| 7:50 PM 12/15 | 1.39 | 0.0955 |
| 7:45 PM 12/15 | 1.39 | 0.0955 |
| 7:40 PM 12/15 | 1.39 | 0.0955 |
| 7:35 PM 12/15 | 1.39 | 0.0955 |
| 7:30 PM 12/15 | 1.39 | 0.0955 |
| 7:25 PM 12/15 | 1.39 | 0.0955 |
| 7:20 PM 12/15 | 1.39 | 0.0955 |
| 7:15 PM 12/15 | 1.4 | 0.098 |
| 7:10 PM 12/15 | 1.4 | 0.098 |
| 7:05 PM 12/15 | 1.4 | 0.098 |
| 7:00 PM 12/15 | 1.4 | 0.098 |
| 6:55 PM 12/15 | 1.4 | 0.098 |
| 6:50 PM 12/15 | 1.4 | 0.098 |
| 6:45 PM 12/15 | 1.4 | 0.098 |
| 6:40 PM 12/15 | 1.4 | 0.098 |
| 6:35 PM 12/15 | 1.4 | 0.098 |
| 6:30 PM 12/15 | 1.4 | 0.098 |
| 6:25 PM 12/15 | 1.4 | 0.098 |
| 6:20 PM 12/15 | 1.4 | 0.098 |
| 6:15 PM 12/15 | 1.4 | 0.098 |
29' -
Buena Vista municipal buildings and downtown areas inundated.
21' -
Water overflows railroad bed, allowing for extensive flooding.
19' -
Evacuation of campers/recreational interests in city park.
17' -
Some areas of city (along left bank) experience overflow.
13' -
One industry (bonded fibers) begins moving equipment.
| Date | Stage (ft) |
|---|---|
| Aug 20, 1969 | 31.23 |
| Nov 5, 1985 | 26.3 |
| Jun 28, 1995 | 19.48 |
| Apr 22, 1992 | 18.99 |
| Sep 7, 1996 | 18.9 |
| Jan 19, 1996 | 18.28 |
| Jun 23, 1995 | 17.95 |
| Oct 21, 1961 | 17.68 |
| Jun 21, 1972 | 17.1 |
| Sep 10, 1950 | 16.2 |
| Jan 26, 1978 | 15.46 |
| Sep 19, 2003 | 15.36 |
| Jan 8, 1998 | 15.2 |
| Jun 13, 1982 | 14.55 |
| Jan 25, 2010 | 14.42 |
| Mar 20, 1975 | 14.07 |
| May 31, 1971 | 14.01 |
| Dec 4, 1948 | 13.84 |
| Mar 1, 1954 | 13.8 |
| Mar 7, 1967 | 13.74 |
Data provided by the National Weather Service.