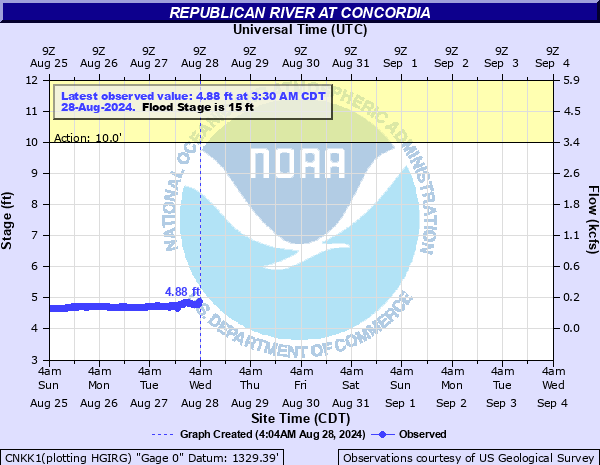
Republican River at Concordia
Critical Stages
10' - Action
15' - Flood
18' - Moderate
30' - Major
Latest Observation
Updated: 10:30 PM CST 12/14/25
Status: No Flooding
Stage: 4.63 ft
Flow: 0.0687 kcfs
Forecast
Forecast not available for this location.
| Time | Stage (ft) | Flow (kcfs) |
|---|---|---|
| 10:30 PM 12/14 | 4.63 | 0.0687 |
| 10:15 PM 12/14 | 4.63 | 0.0687 |
| 10:00 PM 12/14 | 4.65 | 0.0728 |
| 9:45 PM 12/14 | 4.67 | 0.0771 |
| 9:30 PM 12/14 | 4.69 | 0.0816 |
| 9:15 PM 12/14 | 4.7 | 0.084 |
| 9:00 PM 12/14 | 4.69 | 0.0816 |
| 8:45 PM 12/14 | 4.66 | 0.0749 |
| 8:30 PM 12/14 | 4.64 | 0.0707 |
| 8:15 PM 12/14 | 4.63 | 0.0687 |
| 8:00 PM 12/14 | 4.63 | 0.0687 |
| 7:45 PM 12/14 | 4.64 | 0.0707 |
| 7:30 PM 12/14 | 4.68 | 0.0793 |
| 7:15 PM 12/14 | 4.69 | 0.0816 |
| 7:00 PM 12/14 | 4.7 | 0.084 |
| 6:45 PM 12/14 | 4.69 | 0.0816 |
| 6:30 PM 12/14 | 4.66 | 0.0749 |
| 6:15 PM 12/14 | 4.64 | 0.0707 |
| 6:00 PM 12/14 | 4.62 | 0.0668 |
| 5:45 PM 12/14 | 4.62 | 0.0668 |
| 5:30 PM 12/14 | 4.63 | 0.0687 |
| 5:15 PM 12/14 | 4.69 | 0.0816 |
| 5:00 PM 12/14 | 4.7 | 0.084 |
| 4:45 PM 12/14 | 4.54 | 0.0501 |
| 4:30 PM 12/14 | 4.74 | 0.0915 |
| 4:15 PM 12/14 | 4.72 | 0.0877 |
| 4:00 PM 12/14 | 4.7 | 0.084 |
| 3:45 PM 12/14 | 4.68 | 0.0793 |
| 3:30 PM 12/14 | 4.69 | 0.0816 |
| 3:15 PM 12/14 | 4.7 | 0.084 |
23' -
Flooding occurs on U.S. Highway 81 between the Republican River and Concordia.
22' -
The extreme northern parts of Concordia begin to flood.
18' -
Flooding occurs in the towns of Clyde and Norway.
15' -
Minor lowland flooding occurs from the mouth of the Buffalo Creek upstream to the mouth of Elm Creek downstream.
| Date | Stage (ft) |
|---|---|
| Jun 2, 1935 | 23 |
| Jun 25, 1947 | 19.9 |
| Jul 22, 1993 | 19.77 |
| Jun 21, 1915 | 19.1 |
| Oct 12, 1973 | 18.98 |
| Feb 4, 1943 | 18.8 |
| Jun 9, 1941 | 18.8 |
| Sep 13, 1961 | 18.3 |
| Jun 18, 1957 | 18.11 |
| Sep 5, 1958 | 18.06 |
| Jun 26, 1963 | 17.52 |
| Jun 20, 1935 | 17.4 |
| May 29, 1903 | 17.2 |
| Nov 18, 1996 | 17.12 |
| Jun 24, 2003 | 16.95 |
| Jun 15, 1943 | 16.9 |
| May 14, 1945 | 16.7 |
| Aug 19, 1968 | 16.58 |
| May 28, 1935 | 16.55 |
| Jul 13, 1951 | 16.23 |
Data provided by the National Weather Service.