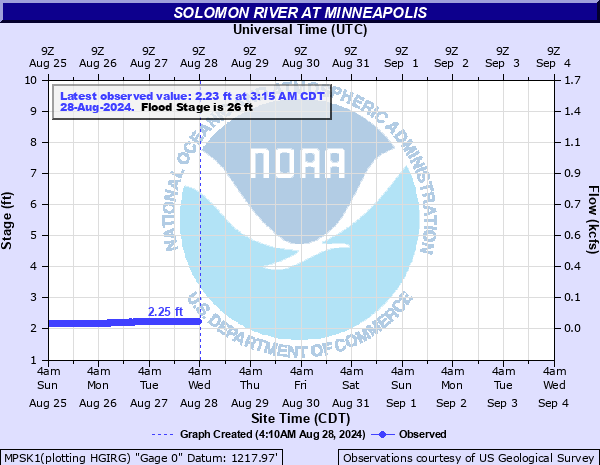
Solomon River at Minneapolis
Critical Stages
21' - Action
26' - Flood
30' - Moderate
38' - Major
Latest Observation
Updated: 10:15 PM CST 12/14/25
Status: No Flooding
Stage: 2.14 ft
Flow: -999 kcfs
Forecast
Forecast not available for this location.
| Time | Stage (ft) | Flow (kcfs) |
|---|---|---|
| 10:15 PM 12/14 | 2.14 | -999 |
| 10:00 PM 12/14 | 2.14 | -999 |
| 9:45 PM 12/14 | 2.14 | -999 |
| 9:30 PM 12/14 | 2.14 | -999 |
| 9:15 PM 12/14 | 2.14 | -999 |
| 9:00 PM 12/14 | 2.14 | -999 |
| 8:45 PM 12/14 | 2.14 | -999 |
| 8:30 PM 12/14 | 2.14 | -999 |
| 8:15 PM 12/14 | 2.13 | -999 |
| 8:00 PM 12/14 | 2.14 | -999 |
| 7:45 PM 12/14 | 2.13 | -999 |
| 7:30 PM 12/14 | 2.13 | -999 |
| 7:15 PM 12/14 | 2.13 | -999 |
| 7:00 PM 12/14 | 2.13 | -999 |
| 6:45 PM 12/14 | 2.13 | -999 |
| 6:30 PM 12/14 | 2.13 | -999 |
| 6:15 PM 12/14 | 2.12 | -999 |
| 6:00 PM 12/14 | 2.12 | -999 |
| 5:45 PM 12/14 | 2.12 | -999 |
| 5:30 PM 12/14 | 2.12 | -999 |
| 5:15 PM 12/14 | 2.11 | -999 |
| 5:00 PM 12/14 | 2.11 | -999 |
| 4:45 PM 12/14 | 2.11 | -999 |
| 4:30 PM 12/14 | 2.11 | -999 |
| 4:15 PM 12/14 | 2.1 | -999 |
| 4:00 PM 12/14 | 2.1 | -999 |
| 3:45 PM 12/14 | 2.09 | -999 |
| 3:30 PM 12/14 | 2.1 | -999 |
| 3:15 PM 12/14 | 2.09 | -999 |
| 3:00 PM 12/14 | 2.09 | -999 |
33' -
Water rises to base of the County Road 106 bridge in Minneapolis.
32.7' -
Flood waters enter first floor of second home south of the river on the east side of Highway 106.
32' -
Baseball field in Ottawa County fairgrounds floods.
31' -
Markley Grove Park floods.
26' -
The river just west of the Highway 106 bridge floods.
23' -
Intersection of the Mulberry Road and 80th Road floods.
| Date | Stage (ft) |
|---|---|
| Jul 13, 1951 | 34.1 |
| Jul 21, 1993 | 32.45 |
| Jul 10, 1993 | 31.12 |
| Jul 6, 1993 | 29.18 |
| Jun 3, 2011 | 28.78 |
| Sep 13, 2003 | 26.4 |
| May 24, 1999 | 26.25 |
| May 9, 2019 | 25.58 |
| Jul 6, 1982 | 25.3 |
| Jul 11, 1982 | 25.12 |
| May 26, 2016 | 24.32 |
| May 12, 1993 | 24.26 |
| Mar 24, 1979 | 23.02 |
| Jun 9, 1995 | 22.9 |
| Mar 31, 1980 | 22.7 |
| Jul 28, 2020 | 22.63 |
| Jul 28, 1981 | 22.51 |
| May 20, 2017 | 22.1 |
| May 3, 2018 | 19.57 |
| Apr 2, 1983 | 19.2 |
Data provided by the National Weather Service.