Bayou Sara at Saraland
Critical Stages
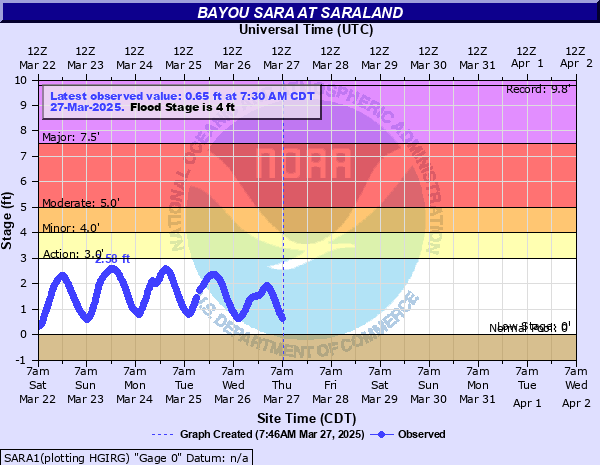
3' - Action
4' - Flood
5' - Moderate
7.5' - Major
Latest Observation
Updated: 11:30 PM CST 12/15/25
Status: No Flooding
Stage: 1.2 ft
Flow: -999 kcfs
Forecast
Forecast not available for this location.
| Time | Stage (ft) | Flow (kcfs) |
|---|---|---|
| 11:30 PM 12/15 | 1.2 | -999 |
| 11:15 PM 12/15 | 1.23 | -999 |
| 11:00 PM 12/15 | 1.26 | -999 |
| 10:45 PM 12/15 | 1.29 | -999 |
| 10:30 PM 12/15 | 1.32 | -999 |
| 10:15 PM 12/15 | 1.33 | -999 |
| 10:00 PM 12/15 | 1.34 | -999 |
| 9:45 PM 12/15 | 1.34 | -999 |
| 9:30 PM 12/15 | 1.33 | -999 |
| 9:15 PM 12/15 | 1.34 | -999 |
| 9:00 PM 12/15 | 1.33 | -999 |
| 8:45 PM 12/15 | 1.31 | -999 |
| 8:30 PM 12/15 | 1.3 | -999 |
| 8:15 PM 12/15 | 1.28 | -999 |
| 8:00 PM 12/15 | 1.25 | -999 |
| 7:45 PM 12/15 | 1.21 | -999 |
| 7:30 PM 12/15 | 1.17 | -999 |
| 7:15 PM 12/15 | 1.13 | -999 |
| 7:00 PM 12/15 | 1.09 | -999 |
| 6:45 PM 12/15 | 1.05 | -999 |
| 6:30 PM 12/15 | 1.01 | -999 |
| 6:15 PM 12/15 | 0.96 | -999 |
| 6:00 PM 12/15 | 0.92 | -999 |
| 5:45 PM 12/15 | 0.88 | -999 |
| 5:30 PM 12/15 | 0.84 | -999 |
| 5:15 PM 12/15 | 0.8 | -999 |
| 5:00 PM 12/15 | 0.75 | -999 |
| 4:45 PM 12/15 | 0.72 | -999 |
| 4:30 PM 12/15 | 0.69 | -999 |
| 4:15 PM 12/15 | 0.66 | -999 |
14.3' -
Flooding of the U.S. 43 bridge and the I-65 bridge occur.
11' -
Extensive flooding will occur along Bayou Sara and Norton Creeks with many bridges flooded.
8.3' -
Bayou Sara Avenue floods east of gauging site. Numerous houses and streets flood east of the railroad between Bayou Sara and Norton Creek.
7.9' -
Streets along Bayou Sara flood. Low lying areas along Gunnison Creek in Satuma flood. Above 8 feet, numererous streets and houses east of the railroad between Bayou Sara and Norton Creeks flood.
7.5' -
Numerous houses flood at 7.5 feet and some evacuations also become necessary.
6' -
Flooding of residences in the area will occur.
5' -
Street flooding east of the railroad becomes widespread.
4' -
Flooding of streets begin.
| Date | Stage (ft) |
|---|---|
| Sep 28, 1998 | 9.8 |
| Sep 1, 2008 | 9.3 |
| Feb 25, 2020 | 7.9 |
| Apr 26, 1979 | 7.84 |
| Apr 13, 1980 | 7.8 |
| Apr 3, 1980 | 7.5 |
| Apr 1, 2005 | 7 |
| Aug 30, 2021 | 7 |
| Feb 28, 1990 | 6.95 |
| May 10, 1995 | 6.8 |
| Oct 8, 2017 | 6.7 |
| Jul 20, 1997 | 6.6 |
| Jun 8, 2020 | 6 |
| Mar 28, 1990 | 5.85 |
| Apr 7, 2025 | 5.71 |
| Jan 9, 2019 | 5.5 |
| Feb 10, 1996 | 5.5 |
| Apr 8, 1976 | 5.5 |
| Jun 22, 2017 | 5.5 |
| Mar 15, 2020 | 5.5 |
Data provided by the National Weather Service.