« Back to Wildhorse Golf Club At Robson Ranch Rivers
North Texas Lakes at Lake Worth
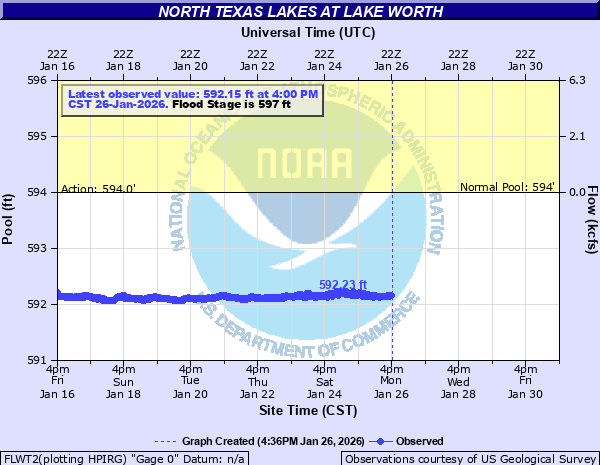
Critical Stages
594' - Action
597' - Flood
598' - Moderate
599' - Major
Latest Observation
Updated: 6:00 AM CST 12/6/25
Status: No Flooding
Stage: 592.36 ft
Flow: -999 kcfs
Forecast
Forecast not available for this location.
| Time | Stage (ft) | Flow (kcfs) |
|---|---|---|
| 6:00 AM 12/6 | 592.36 | -999 |
| 5:45 AM 12/6 | 592.36 | -999 |
| 5:30 AM 12/6 | 592.36 | -999 |
| 5:15 AM 12/6 | 592.35 | -999 |
| 5:00 AM 12/6 | 592.35 | -999 |
| 4:45 AM 12/6 | 592.37 | -999 |
| 4:30 AM 12/6 | 592.36 | -999 |
| 4:15 AM 12/6 | 592.36 | -999 |
| 4:00 AM 12/6 | 592.36 | -999 |
| 3:45 AM 12/6 | 592.36 | -999 |
| 3:30 AM 12/6 | 592.36 | -999 |
| 3:15 AM 12/6 | 592.36 | -999 |
| 3:00 AM 12/6 | 592.36 | -999 |
| 2:45 AM 12/6 | 592.37 | -999 |
| 2:30 AM 12/6 | 592.37 | -999 |
| 2:15 AM 12/6 | 592.36 | -999 |
| 2:00 AM 12/6 | 592.37 | -999 |
| 1:45 AM 12/6 | 592.37 | -999 |
| 1:30 AM 12/6 | 592.36 | -999 |
| 1:15 AM 12/6 | 592.37 | -999 |
| 1:00 AM 12/6 | 592.37 | -999 |
| 12:45 AM 12/6 | 592.36 | -999 |
| 12:30 AM 12/6 | 592.37 | -999 |
| 12:15 AM 12/6 | 592.38 | -999 |
| 12:00 AM 12/6 | 592.37 | -999 |
| 11:45 PM 12/5 | 592.37 | -999 |
| 11:30 PM 12/5 | 592.37 | -999 |
| 11:15 PM 12/5 | 592.38 | -999 |
| 11:00 PM 12/5 | 592.38 | -999 |
| 10:45 PM 12/5 | 592.37 | -999 |
599' -
Major flooding will occur, with many houses along the lake shore flooded.
598.7' -
Major flooding will occur along the lake shore. Some houses will be flooded.
598.5' -
Major flood problems will occur along the lake shore. Several houses will begin to flood.
598' -
Moderate flooding will occur along the lake shore.
597' -
Minor flood problems will occur. Water will begin to flood low areas around the lake.
595' -
Minor water flow over the spillway is expected but no flooding is forecast.
594' -
No flood problems are expected. Water will flow over the spillway.
| Date | Stage (ft) |
|---|---|
| May 3, 1990 | 598.7 |
| Oct 14, 1981 | 598.13 |
| Dec 20, 1991 | 597.98 |
| May 25, 1957 | 597.9 |
| Jun 13, 1989 | 597.82 |
| Jun 10, 2004 | 597.78 |
| Jun 20, 2015 | 597.47 |
| Apr 22, 2016 | 597.08 |
| May 13, 1994 | 596.11 |
| Feb 27, 2001 | 595.47 |
| Mar 1, 2001 | 595.33 |
Data provided by the National Weather Service.