Eagle River near Eagle River
Critical Stages
7' - Action
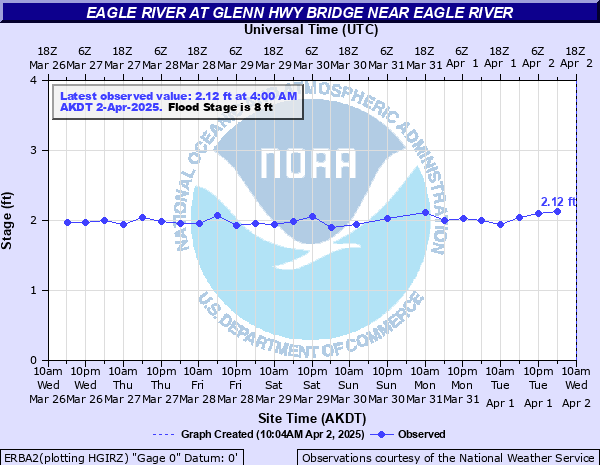
8' - Flood
Moderate
Major
Latest Observation
Updated: 3:00 AM AKST 12/10/25
Status: No Flooding
Stage: 4.06 ft
Flow: 1.11 kcfs
Forecast
Forecast not available for this location.
| Time | Stage (ft) | Flow (kcfs) |
|---|---|---|
| 3:00 AM 12/10 | 4.06 | 1.11 |
| 9:00 PM 12/9 | 3.96 | 1.01 |
| 3:00 PM 12/9 | 3.78 | 0.827 |
| 9:00 AM 12/9 | 3.99 | 1.04 |
| 3:00 AM 12/9 | 3.95 | 0.999 |
| 9:00 PM 12/8 | 3.98 | 1.03 |
| 3:00 PM 12/8 | 3.54 | 0.583 |
| 9:00 AM 12/8 | 3.02 | 0.0516 |
| 3:00 AM 12/8 | 2.67 | -999 |
| 9:00 PM 12/7 | 2.45 | -999 |
| 3:00 PM 12/7 | 2.35 | -999 |
| 10:00 AM 12/7 | 2.32 | -999 |
| 3:00 AM 12/7 | 2.36 | -999 |
| 9:00 PM 12/6 | 2.41 | -999 |
| 3:00 PM 12/6 | 2.42 | -999 |
| 9:00 AM 12/6 | 2.44 | -999 |
| 3:00 AM 12/6 | 2.46 | -999 |
| 9:00 PM 12/5 | 2.52 | -999 |
| 3:00 PM 12/5 | 2.53 | -999 |
| 9:00 AM 12/5 | 2.58 | -999 |
| 3:00 AM 12/5 | 2.56 | -999 |
| 9:00 PM 12/4 | 2.54 | -999 |
| 3:00 PM 12/4 | 2.58 | -999 |
| 9:00 AM 12/4 | 2.53 | -999 |
| 3:00 AM 12/4 | 2.49 | -999 |
| 9:00 PM 12/3 | 2.61 | -999 |
| 3:00 PM 12/3 | 2.6 | -999 |
| 10:00 AM 12/3 | 2.61 | -999 |
| 3:00 AM 12/3 | 2.62 | -999 |
| 9:00 PM 12/2 | 2.5 | -999 |
11' -
September 21-23, 1995 USGS surveyed area and reported a stage of 11.0 ft and a flow of 10,300 cfs (500 year flood). Some damage to bridges on Fort Richardson.
8.5' -
Water will begin to inundate the Day Use area of the Eagle River State Campground near the Glenn Highway.
6' -
Water will be waist high on most hikers fording the river as part of the Crow Pass Trail.
3.4' -
At or below this level, water level readings are influenced by rocks/dirt and are likely not representative of actual water levels.
| Date | Stage (ft) |
|---|---|
| Sep 21, 1995 | 11 |
| Aug 6, 1992 | 7.9 |
| Sep 23, 2012 | 7.83 |
| Aug 13, 1990 | 7.73 |
| Aug 18, 1991 | 7.53 |
| Jul 8, 2009 | 7.19 |
| Aug 18, 2015 | 7.12 |
| Nov 7, 2005 | 6.59 |
| Oct 4, 2003 | 6.36 |
| Jul 6, 2019 | 6.17 |
| Sep 3, 2013 | 6.17 |
| Aug 20, 2006 | 6.08 |
| Sep 13, 2014 | 5.94 |
| Aug 13, 1997 | 5.9 |
| Jun 28, 2004 | 5.9 |
| Jul 20, 2021 | 5.87 |
| Jul 20, 2020 | 5.87 |
| Aug 13, 1999 | 5.79 |
| Aug 3, 2011 | 5.78 |
| Aug 22, 2018 | 5.77 |
Data provided by the National Weather Service.