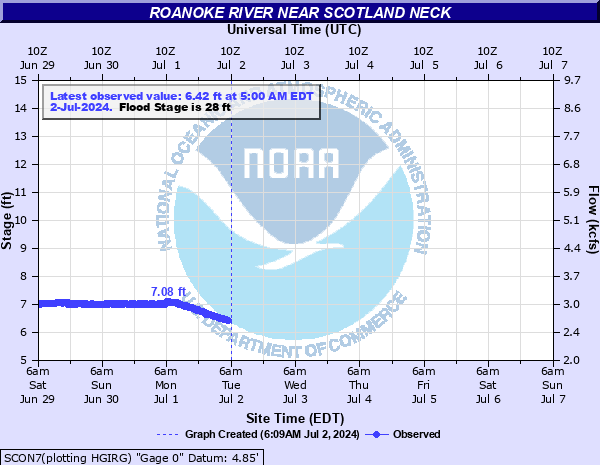
Roanoke River near Scotland Neck
Critical Stages
28' - Action
28' - Flood
31' - Moderate
34' - Major
Latest Observation
Updated: 3:00 PM EST 12/15/25
Status: No Flooding
Stage: 7.65 ft
Flow: 3.43 kcfs
Forecast
Forecast not available for this location.
| Time | Stage (ft) | Flow (kcfs) |
|---|---|---|
| 3:00 PM 12/15 | 7.65 | 3.43 |
| 2:45 PM 12/15 | 7.63 | 3.41 |
| 2:30 PM 12/15 | 7.64 | 3.42 |
| 2:15 PM 12/15 | 7.63 | 3.41 |
| 2:00 PM 12/15 | 7.61 | 3.4 |
| 1:45 PM 12/15 | 7.62 | 3.41 |
| 1:30 PM 12/15 | 7.62 | 3.41 |
| 1:15 PM 12/15 | 7.63 | 3.41 |
| 1:00 PM 12/15 | 7.64 | 3.42 |
| 12:45 PM 12/15 | 7.63 | 3.41 |
| 12:30 PM 12/15 | 7.59 | 3.39 |
| 12:15 PM 12/15 | 7.62 | 3.41 |
| 12:00 PM 12/15 | 7.62 | 3.41 |
| 11:45 AM 12/15 | 7.62 | 3.41 |
| 11:30 AM 12/15 | 7.58 | 3.38 |
| 11:15 AM 12/15 | 7.6 | 3.39 |
| 11:00 AM 12/15 | 7.58 | 3.38 |
| 10:45 AM 12/15 | 7.61 | 3.4 |
| 10:30 AM 12/15 | 7.61 | 3.4 |
| 10:15 AM 12/15 | 7.6 | 3.39 |
| 10:00 AM 12/15 | 7.58 | 3.38 |
| 9:45 AM 12/15 | 7.59 | 3.39 |
| 9:30 AM 12/15 | 7.6 | 3.39 |
| 9:15 AM 12/15 | 7.58 | 3.38 |
| 9:00 AM 12/15 | 7.6 | 3.39 |
| 8:45 AM 12/15 | 7.59 | 3.39 |
| 8:30 AM 12/15 | 7.58 | 3.38 |
| 8:15 AM 12/15 | 7.57 | 3.37 |
| 8:00 AM 12/15 | 7.57 | 3.37 |
| 7:45 AM 12/15 | 7.57 | 3.37 |
47' -
The US-258 bridge is inundated.
40' -
Flooding reaches the lower steel trusses of the US258 bridge.
34' -
Major flooding begins. There is widespread, mainly lowland flooding adjacent to the river.
32' -
The boat ramp and parking lot at Edwards Ferry Boat Access are inundated.
31' -
Moderate flooding begins. There is widespread flooding on the left bank.
28' -
Minor flooding begins. The left bank of the Little Roanoke River begins to flood.
| Date | Stage (ft) |
|---|---|
| Aug 19, 1940 | 41.98 |
| Sep 23, 1945 | 37.05 |
| Sep 23, 1944 | 36.02 |
| Jan 24, 1936 | 35.1 |
| Feb 18, 1948 | 33.9 |
| Dec 9, 1948 | 33.26 |
| Feb 10, 1943 | 31.51 |
| Jan 2, 1946 | 31.25 |
| Sep 17, 1999 | 30.98 |
| Sep 29, 1947 | 30.79 |
| Apr 18, 1975 | 30.3 |
| Sep 18, 1996 | 30.1 |
| Dec 2, 2018 | 30.05 |
| Feb 27, 2021 | 29.98 |
| Oct 27, 2018 | 29.92 |
| May 7, 2017 | 29.9 |
| Oct 6, 2018 | 28.81 |
Data provided by the National Weather Service.