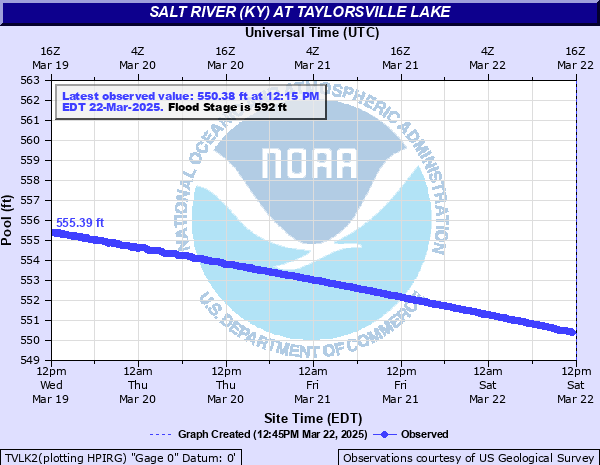
Salt River (KY) at Taylorsville Lake
Critical Stages
590' - Action
592' - Flood
592' - Moderate
597' - Major
Latest Observation
Updated: 4:15 PM EST 12/6/25
Status: No Flooding
Stage: 545.09 ft
Flow: -999 kcfs
Forecast
Forecast not available for this location.
| Time | Stage (ft) | Flow (kcfs) |
|---|---|---|
| 5:15 PM 12/6 | 545.09 | -999 |
| 5:10 PM 12/6 | 545.09 | -999 |
| 5:05 PM 12/6 | 545.09 | -999 |
| 5:00 PM 12/6 | 545.09 | -999 |
| 4:55 PM 12/6 | 545.09 | -999 |
| 4:50 PM 12/6 | 545.09 | -999 |
| 4:45 PM 12/6 | 545.09 | -999 |
| 4:40 PM 12/6 | 545.09 | -999 |
| 4:35 PM 12/6 | 545.09 | -999 |
| 4:30 PM 12/6 | 545.09 | -999 |
| 4:25 PM 12/6 | 545.09 | -999 |
| 4:20 PM 12/6 | 545.09 | -999 |
| 4:15 PM 12/6 | 545.09 | -999 |
| 4:10 PM 12/6 | 545.09 | -999 |
| 4:05 PM 12/6 | 545.09 | -999 |
| 4:00 PM 12/6 | 545.09 | -999 |
| 3:55 PM 12/6 | 545.09 | -999 |
| 3:50 PM 12/6 | 545.09 | -999 |
| 3:45 PM 12/6 | 545.09 | -999 |
| 3:40 PM 12/6 | 545.09 | -999 |
| 3:35 PM 12/6 | 545.09 | -999 |
| 3:30 PM 12/6 | 545.09 | -999 |
| 3:25 PM 12/6 | 545.09 | -999 |
| 3:20 PM 12/6 | 545.09 | -999 |
| 3:15 PM 12/6 | 545.09 | -999 |
| 3:10 PM 12/6 | 545.09 | -999 |
| 3:05 PM 12/6 | 545.09 | -999 |
| 3:00 PM 12/6 | 545.09 | -999 |
| 2:55 PM 12/6 | 545.09 | -999 |
| 2:50 PM 12/6 | 545.09 | -999 |
623' -
Top of dam.
592.2' -
Record elevation on 05/05/2011
592' -
Flood pool, spillway elevation.
565' -
Boat launch difficult and limited parking at Van Buren ramp.
563' -
Boat launch difficult and limited parking at Chowning Lane ramp.
562' -
Settlers Trace area inaccessible by road, causeway inundated.
558' -
Boat launch difficult and limited parking at Settlers Trace ramp.
547' -
Summer Pool
545' -
Winter Pool
538' -
Water below lower end of Chowning Lane ramp.
537.6' -
Water below lower end of Ashes Creek ramp.
519' -
Water below lower end of Settlers Trace ramp.
| Date | Stage (ft) |
|---|---|
| May 5, 2011 | 592.2 |
| Mar 11, 1997 | 586.5 |
| Feb 23, 1989 | 580.4 |
| Jan 12, 1991 | 579.8 |
| Apr 16, 2015 | 575.8 |
| May 5, 2010 | 571.9 |
| Apr 7, 2008 | 571.7 |
| Mar 31, 2002 | 569.1 |
| May 22, 1995 | 568.7 |
| Jun 3, 2004 | 567.6 |
| May 23, 1983 | 565.3 |
| May 10, 1984 | 563.5 |
| Sep 26, 2006 | 563.3 |
| Feb 26, 2003 | 562.8 |
Data provided by the National Weather Service.