« Back to Windemere Lake Rivers
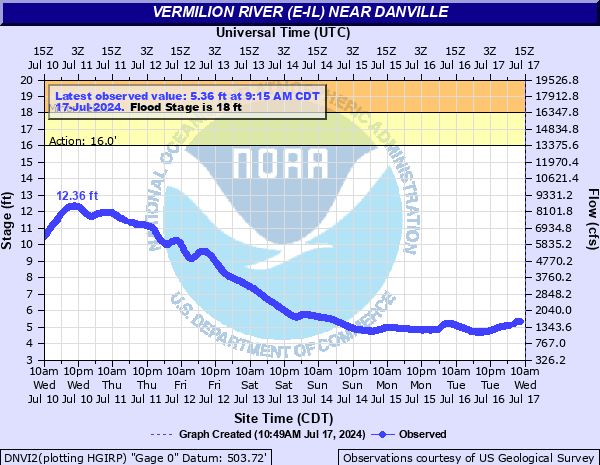
Vermilion River (E-IL) near Danville
Critical Stages
16' - Action
18' - Flood
22' - Moderate
28' - Major
Latest Observation
Updated: 3:15 PM CST 12/16/25
Status: No Flooding
Stage: 2.11 ft
Flow: 0.0932 kcfs
Forecast
Forecast not available for this location.
| Time | Stage (ft) | Flow (kcfs) |
|---|---|---|
| 3:15 PM 12/16 | 2.11 | 0.0932 |
| 3:00 PM 12/16 | 2.14 | 0.098 |
| 2:45 PM 12/16 | 2.12 | 0.0948 |
| 2:30 PM 12/16 | 2.12 | 0.0948 |
| 2:15 PM 12/16 | 2.1 | 0.0916 |
| 2:00 PM 12/16 | 2.09 | 0.09 |
| 1:45 PM 12/16 | 2.12 | 0.0948 |
| 1:30 PM 12/16 | 2.12 | 0.0948 |
| 1:15 PM 12/16 | 2.15 | 0.0996 |
| 1:00 PM 12/16 | 2.15 | 0.0996 |
| 12:45 PM 12/16 | 2.15 | 0.0996 |
| 12:30 PM 12/16 | 2.15 | 0.0996 |
| 12:15 PM 12/16 | 2.14 | 0.098 |
| 12:00 PM 12/16 | 2.13 | 0.0964 |
| 11:45 AM 12/16 | 2.12 | 0.0948 |
| 11:30 AM 12/16 | 2.12 | 0.0948 |
| 11:15 AM 12/16 | 2.12 | 0.0948 |
| 11:00 AM 12/16 | 2.12 | 0.0948 |
| 8:15 AM 12/11 | 2.02 | 0.0792 |
| 8:00 AM 12/11 | 2.02 | 0.0792 |
| 7:45 AM 12/11 | 2.02 | 0.0792 |
| 7:30 AM 12/11 | 2.02 | 0.0792 |
| 7:15 AM 12/11 | 2.02 | 0.0792 |
| 7:00 AM 12/11 | 2.02 | 0.0792 |
| 6:45 AM 12/11 | 2.02 | 0.0792 |
| 6:30 AM 12/11 | 2.02 | 0.0792 |
| 6:15 AM 12/11 | 2.02 | 0.0792 |
| 6:00 AM 12/11 | 2.02 | 0.0792 |
| 5:45 AM 12/11 | 2.02 | 0.0792 |
| 5:30 AM 12/11 | 2.02 | 0.0792 |
36.7' -
Water overtops Danville Sanitary District berm.
28' -
Flooding begins to a small trailer park in Eugene Indiana and damage begins to a few homes in Cayuga Indiana.
26' -
Flooding begins downstream in Eugene and Cayuga Indiana.
18' -
Minor flooding begins to some secondary roads and agricultural land not protected by levees.
| Date | Stage (ft) |
|---|---|
| Apr 13, 1994 | 31.56 |
| Mar 13, 1939 | 28.59 |
| Feb 22, 2018 | 27.42 |
| May 19, 1943 | 27.09 |
| Feb 11, 1959 | 26.95 |
| Dec 29, 2015 | 26.66 |
| Feb 7, 2008 | 26.3 |
| Dec 31, 1990 | 25.4 |
| Mar 12, 1990 | 25.11 |
| May 3, 1983 | 24.83 |
| Apr 21, 1964 | 24.82 |
| Feb 24, 1985 | 24.75 |
| Apr 20, 2013 | 24.3 |
| Jan 5, 1950 | 24.24 |
| Jun 16, 1998 | 23.82 |
| Mar 5, 1979 | 23.64 |
| Feb 22, 1951 | 23.41 |
| Jan 5, 1993 | 23.21 |
| Jun 8, 2015 | 22.83 |
| Feb 27, 1936 | 22.76 |
Data provided by the National Weather Service.