Rock River at Rockton
Critical Stages
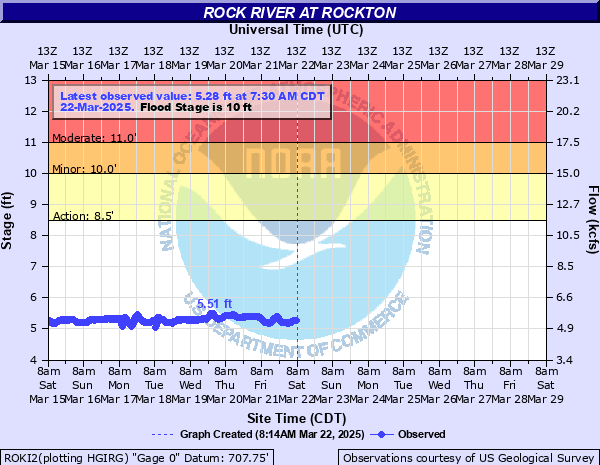
8.5' - Action
10' - Flood
11' - Moderate
14' - Major
Latest Observation
Updated: 11:30 PM CST 12/16/25
Status: No Flooding
Stage: 4.01 ft
Flow: 3.07 kcfs
Forecast
Forecast not available for this location.
| Time | Stage (ft) | Flow (kcfs) |
|---|---|---|
| 11:30 PM 12/16 | 4.01 | 3.07 |
| 11:15 PM 12/16 | 4.01 | 3.07 |
| 11:00 PM 12/16 | 4.02 | 3.09 |
| 10:45 PM 12/16 | 4.03 | 3.1 |
| 10:30 PM 12/16 | 4.04 | 3.12 |
| 10:15 PM 12/16 | 4.04 | 3.12 |
| 10:00 PM 12/16 | 4.06 | 3.15 |
| 9:45 PM 12/16 | 4.06 | 3.15 |
| 9:30 PM 12/16 | 4.08 | 3.17 |
| 9:15 PM 12/16 | 4.1 | 3.2 |
| 9:00 PM 12/16 | 4.1 | 3.2 |
| 8:45 PM 12/16 | 4.12 | 3.23 |
| 8:30 PM 12/16 | 4.14 | 3.26 |
| 8:15 PM 12/16 | 4.16 | 3.29 |
| 8:00 PM 12/16 | 4.18 | 3.32 |
| 7:45 PM 12/16 | 4.21 | 3.36 |
| 7:30 PM 12/16 | 4.23 | 3.39 |
| 7:15 PM 12/16 | 4.24 | 3.41 |
| 7:00 PM 12/16 | 4.26 | 3.44 |
| 6:45 PM 12/16 | 4.26 | 3.44 |
| 6:30 PM 12/16 | 4.27 | 3.45 |
| 6:15 PM 12/16 | 4.27 | 3.45 |
| 6:00 PM 12/16 | 4.27 | 3.45 |
| 5:45 PM 12/16 | 4.27 | 3.45 |
| 5:30 PM 12/16 | 4.27 | 3.45 |
| 5:15 PM 12/16 | 4.27 | 3.45 |
| 5:00 PM 12/16 | 4.27 | 3.45 |
| 4:45 PM 12/16 | 4.27 | 3.45 |
| 4:30 PM 12/16 | 4.27 | 3.45 |
| 4:15 PM 12/16 | 4.26 | 3.44 |
17.5' -
Structures threatened along Hawick Street in downtown Rockton.
17' -
Rockton Road is threatened west of Rockton.
15' -
Hawick Street threatened near Settlers Park in Rockton.
14' -
Low-lying structures threatened off Main Street in Rockton. Roscoe Road threatened west of Roscoe. Prairie Hill Road inundated north of Rockton.
13.5' -
Old River Road threatened west of Roscoe Bridge.
12' -
Multiple low-lying roads threatened along the river in Roscoe.
10.5' -
Edgemere Terrace threatened near Roscoe.
10' -
Low-lying structures are threatened along Edgemere Terrace near Roscoe.
9' -
Low-lying areas of Settlers Park in Rockton are inundated.
8' -
Water overflows low-lying banks along Edgemere Terrace near Roscoe.
7' -
Low-lying areas of Riverside Park near Roscoe are inundated.
| Date | Stage (ft) |
|---|---|
| Mar 25, 1975 | 15.54 |
| Mar 17, 2019 | 15.13 |
| Mar 22, 1904 | 14.8 |
| Jun 17, 2008 | 14.72 |
| Apr 4, 1959 | 14.08 |
| Mar 20, 1948 | 13.82 |
| Oct 7, 2018 | 13.77 |
| Feb 26, 2018 | 13.51 |
| Apr 2, 1960 | 13.49 |
| Apr 21, 2013 | 13.46 |
| Apr 22, 1973 | 13.4 |
| Jul 29, 2010 | 13.39 |
| Jul 28, 2017 | 13.14 |
| Oct 7, 2019 | 13 |
| Mar 16, 1943 | 12.88 |
| Apr 21, 1993 | 12.84 |
| Apr 2, 1979 | 12.75 |
| Jun 14, 2000 | 12.66 |
| Mar 26, 1905 | 12.56 |
| Mar 3, 1906 | 12.3 |
Data provided by the National Weather Service.