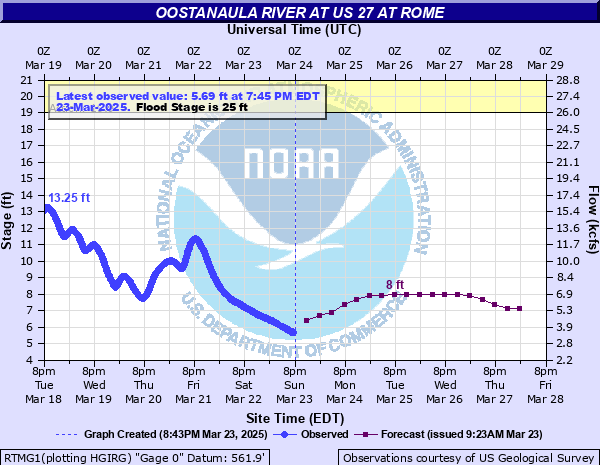
Oostanaula River at US 27 at Rome
Critical Stages
19' - Action
25' - Flood
28' - Moderate
32' - Major
Latest Observation
Updated: 12:45 PM EST 12/9/25
Status: No Flooding
Stage: 3.52 ft
Flow: 1.91 kcfs
Forecast
| Time | Stage (ft) | Flow (kcfs) |
|---|---|---|
| 7 PM 12/9 | 3.4 | 1.83 |
| 1 AM 12/10 | 4.9 | 2.74 |
| 7 AM 12/10 | 5.5 | 3.33 |
| 1 PM 12/10 | 5.6 | 3.44 |
| 7 PM 12/10 | 5.6 | 3.44 |
| 1 AM 12/11 | 5.7 | 3.55 |
| 7 AM 12/11 | 5.7 | 3.55 |
| 1 PM 12/11 | 5.7 | 3.55 |
| 7 PM 12/11 | 5.7 | 3.55 |
| 1 AM 12/12 | 5.7 | 3.55 |
| 7 AM 12/12 | 5.6 | 3.44 |
| 1 PM 12/12 | 5.6 | 3.44 |
| 7 PM 12/12 | 5.6 | 3.44 |
| 1 AM 12/13 | 4.6 | 2.56 |
| 7 AM 12/13 | 3.9 | 2.14 |
| 1 PM 12/13 | 3.6 | 1.96 |
| 7 PM 12/13 | 3.6 | 1.96 |
| 1 AM 12/14 | 3.6 | 1.96 |
| 7 AM 12/14 | 3.6 | 1.96 |
| Time | Stage (ft) | Flow (kcfs) |
|---|---|---|
| 12:45 PM 12/9 | 3.52 | 1.91 |
| 12:30 PM 12/9 | 3.52 | 1.91 |
| 12:15 PM 12/9 | 3.52 | 1.91 |
| 12:00 PM 12/9 | 3.56 | 1.93 |
| 11:45 AM 12/9 | 3.56 | 1.93 |
| 11:30 AM 12/9 | 3.58 | 1.94 |
| 11:15 AM 12/9 | 3.59 | 1.95 |
| 11:00 AM 12/9 | 3.62 | 1.97 |
| 10:45 AM 12/9 | 3.64 | 1.98 |
| 10:30 AM 12/9 | 3.65 | 1.99 |
| 10:15 AM 12/9 | 3.67 | 2 |
| 10:00 AM 12/9 | 3.69 | 2.01 |
| 9:45 AM 12/9 | 3.72 | 2.03 |
| 9:30 AM 12/9 | 3.73 | 2.03 |
| 9:15 AM 12/9 | 3.76 | 2.05 |
| 9:00 AM 12/9 | 3.78 | 2.06 |
| 8:45 AM 12/9 | 3.81 | 2.08 |
| 8:30 AM 12/9 | 3.82 | 2.09 |
| 8:15 AM 12/9 | 3.84 | 2.1 |
| 8:00 AM 12/9 | 3.88 | 2.13 |
| 7:45 AM 12/9 | 3.9 | 2.14 |
| 7:30 AM 12/9 | 3.93 | 2.16 |
| 7:15 AM 12/9 | 3.95 | 2.17 |
| 7:00 AM 12/9 | 3.98 | 2.19 |
| 6:45 AM 12/9 | 4.01 | 2.21 |
| 6:30 AM 12/9 | 4.04 | 2.22 |
| 6:15 AM 12/9 | 4.07 | 2.24 |
| 6:00 AM 12/9 | 4.09 | 2.25 |
| 5:45 AM 12/9 | 4.12 | 2.27 |
| 5:30 AM 12/9 | 4.16 | 2.29 |
46' -
Highway 27...5th Avenue bridge floods. Many businesses and homes flooded.
42' -
The levee of the Oostanaula will reach the top of the city levee. This is a very serious situation. Floyd Medical Center...Law Enforcement Center and numerous businesses flood.
40.3' -
The record crest was 40.30 feet on April 1...1886.
38' -
Major flooding expands. Water will reach Broad Street. This is the 100 year flood.
36' -
Major flooding continues. Water overflows at the lowest point of Summerville Road.
34.5' -
Major flooding continues. Six city blocks of basements in Rome near the Oostanaula River will flood. Water will cover the 200 block of East Second Avenue.
32' -
Major flooding begins. Flooding of Rome Sewage Treatment Plant begins. Fifth Avenue Bridge is closed. Water overflows onto Second Avenue between railroad and bridge.
30' -
Moderate flooding expands. Water enters Georgia Power Maintenance Yard at Etowah River.
28' -
Moderate flooding begins. Water will enter basements of lower two city blocks near the gage site. Flood gates on Second Avenue and Avenue A must be closed.
25' -
Flood stage is reached. Minor flooding occurs in the woodlands and fields along the river upstream and downstream from the gage on the Turner McCall bridge or U.S. Highway 27. The Heritage Park Rome Greenway continues to flood with some locations up to 5 feet deep. All drainage valves must be closed at the outfalls in Rome. The flood gate on the Rome levee should be closed.
24' -
Bankfull conditions expand along the river upstream and downstream from the gage on the Turner McCall bridge or U.S. Highway 27. The Heritage Park Rome Greenway continues to flood with some locations up to 4 feet deep. The drainage valves must be closed at the American Legion and Police Station Outfalls.
22' -
Bankfull conditions continue along the river upstream and downstream from the gage on the Turner McCall bridge or U.S. Highway 27. The Heritage Park Rome Greenway continues to flood. A drainage valve must be closed at Second Avenue and Avenue A Pump station outfalls.
19' -
Bankfull conditions occur along the river upstream and downstream from the gage on the Turner McCall bridge or U.S. Highway 27. Action Stage is reached with the Heritage Park Rome Greenway beginning to flood within the floodplain.
| Date | Stage (ft) |
|---|---|
| Apr 1, 1886 | 40.3 |
| Jan 15, 1892 | 37.2 |
| Jan 22, 1947 | 34.5 |
| Jul 12, 1916 | 34.3 |
| Mar 18, 1990 | 34.26 |
| Feb 12, 1946 | 34.1 |
| Nov 30, 1948 | 33.9 |
| Jan 9, 1946 | 33.8 |
| Dec 30, 1932 | 33.8 |
| Apr 8, 1936 | 33.7 |
| Feb 6, 1936 | 33.3 |
| Apr 14, 1979 | 33 |
| Dec 11, 1919 | 32.8 |
| Feb 27, 1990 | 32.64 |
| Dec 14, 1932 | 32 |
| Apr 5, 1977 | 31.8 |
| Dec 18, 1932 | 31.8 |
| Apr 5, 1920 | 30.5 |
| Mar 27, 1964 | 30.5 |
| Mar 30, 1951 | 30.5 |
Data provided by the National Weather Service.